The Situation
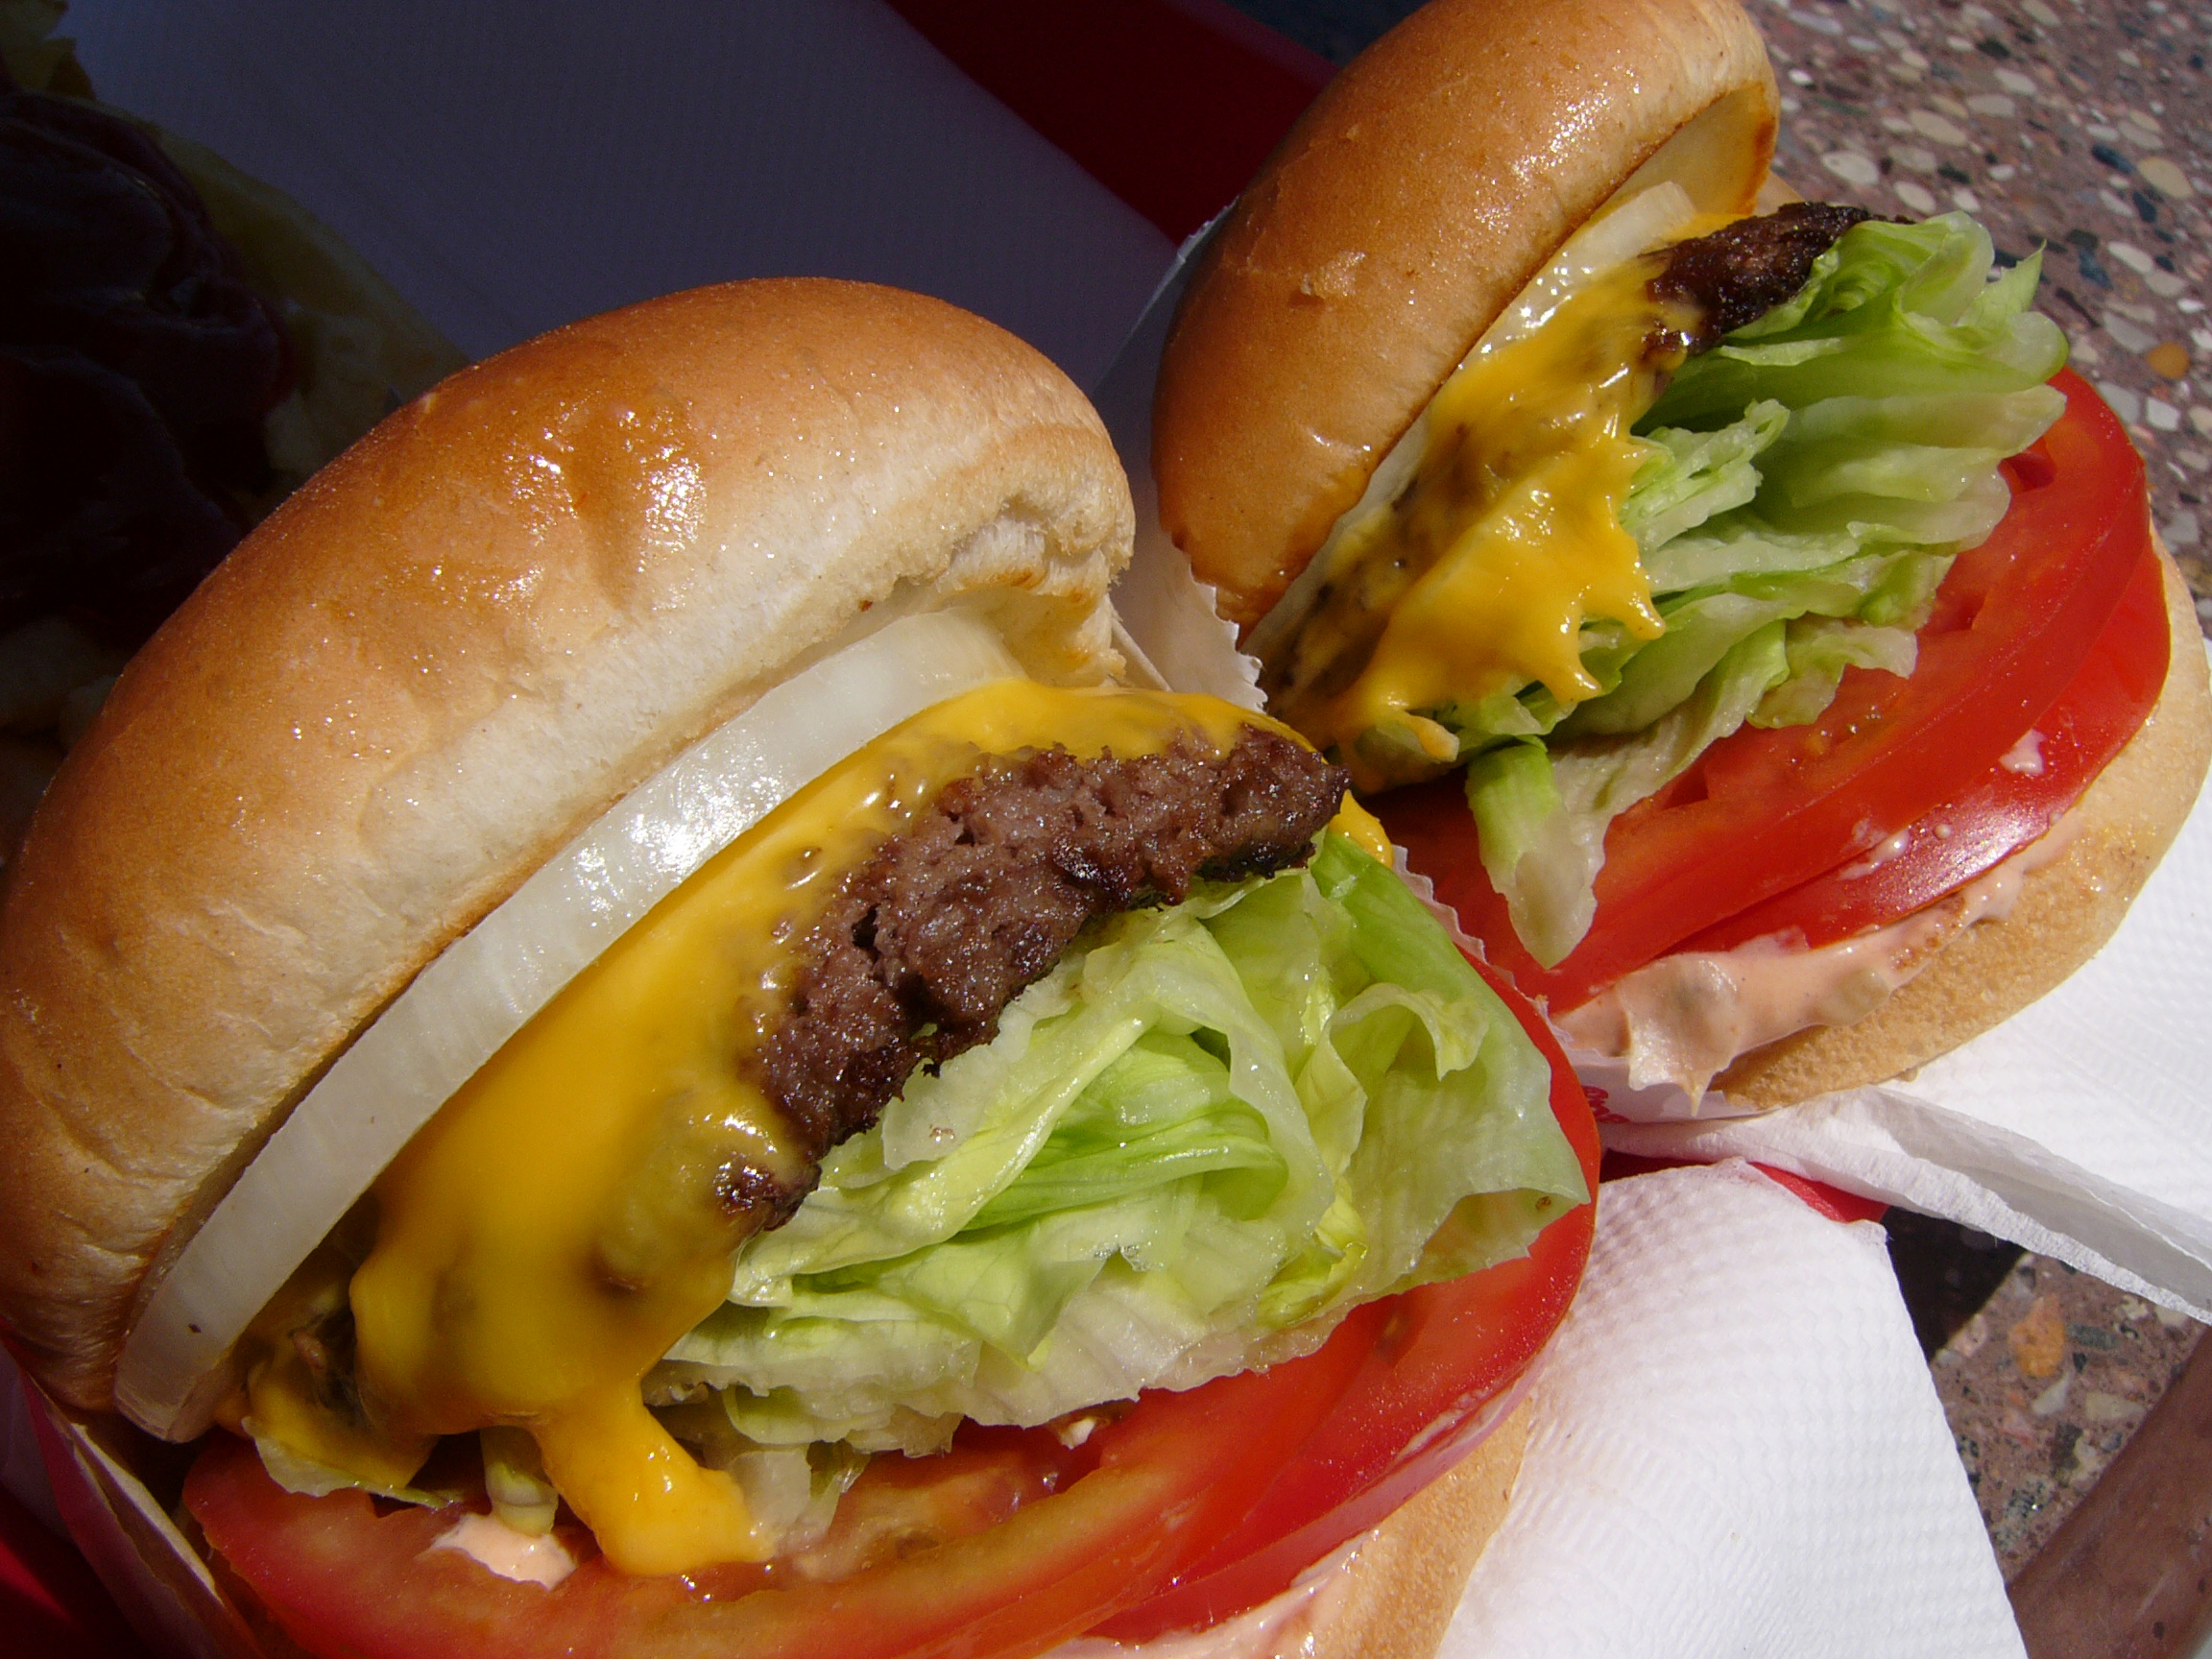
In-N-Out ordinarily sells hamburgers, cheeseburgers, and Double-Doubles (two beef patties and two slices of cheese). While they don’t advertise it, they have a secret menu which includes a burger where you can order as many extra beef patties and cheese slices as you like. The prices and nutrition information are not listed though. The most common orders are 3×3′s (read as “three by three”) and 4 by 4′s (read as “four by four”) that contain three and four layers of beef and cheese, respectively. However some people have ordered 20×20′s (pictured above) and even a 100×100!
The Challenge(s)
- How much money does a 3×3 cost?
- How many calories is a 3×3?
- How much money does a 20×20 cost?
- How many calories is a 20×20?
- How much money does a 100×100 cost?
- How many calories is a 100×100?
- How much money does a NxN cost?
- How many calories is a NxN?
Question(s) To Ask
These questions may be useful in helping students down the problem solving path:
- How would you describe what ingredients are in a 3×3? (To help students realize it is a cheese burger with all the cheese burger toppings plus 2 additional layers of beef patties and cheese)
- How can we figure out how much an additional beef patty and cheese slice cost?
- What are the differences between a cheeseburger and a Double-Double?
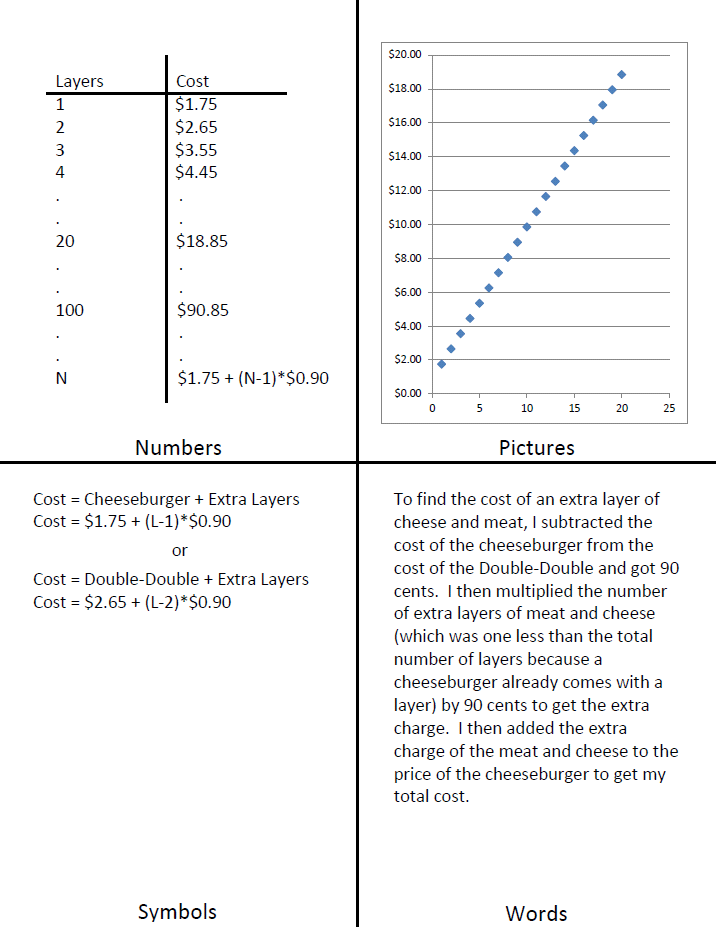
- Where do you see the cost of the extra layer mentioned in the words in the table, graph, and symbols?
- Where do you see the cost of the cheeseburger in the words in the table, graph, and symbols?
- How would your answer change if you had started with a Double-Double and added 98 layers versus a Cheeseburger and added 99 layers?
Consider This
This awesomely gross lesson provides students with a real world context for building linear functions. I recommend beginning with exploring cost before calories because I have included a receipt that shows the actual price of a 100×100 burger. You may choose to begin by asking students about the cost of a 100×100 or start with something smaller like a 3×3. I have found that students with emerging skill sets need to begin with a 3×3 to establish that it is not the same thing as ordering 3 cheeseburgers or a Double-Double and a cheeseburger. Eventually you want them to be able to generalize the cost of a NxN burger.
As much as possible, you want students to do all of the discovery. Make sure to have a conversation about what is on a 100×100. Essentially it is a cheeseburger with 99 additional beef patty and cheese layers or a Double-Double with 98 additional beef patty and cheese layers. There are no additional buns or toppings such as lettuce, tomato, onions, or spread.
We then want to ask students, “How can we figure out how much an additional beef patty and cheese slice cost?” Hopefully they struggle with this question. You may have to ask them, “What are the differences between a cheeseburger and a Double-Double?” We want them to realize that they are the same except for an extra beef patty and cheese slice and a cost difference of $0.90. They can get $0.90 by subtracting the price of a cheeseburger ($1.75) from the price of a Double-Double ($2.65) using the menu below. We want them to make the assumption that perhaps $0.90 is the cost of one layer of beef patty and cheese slice. Note that these prices were from 2004 and were used so they matched the receipt that has the price of the 100×100 on it.

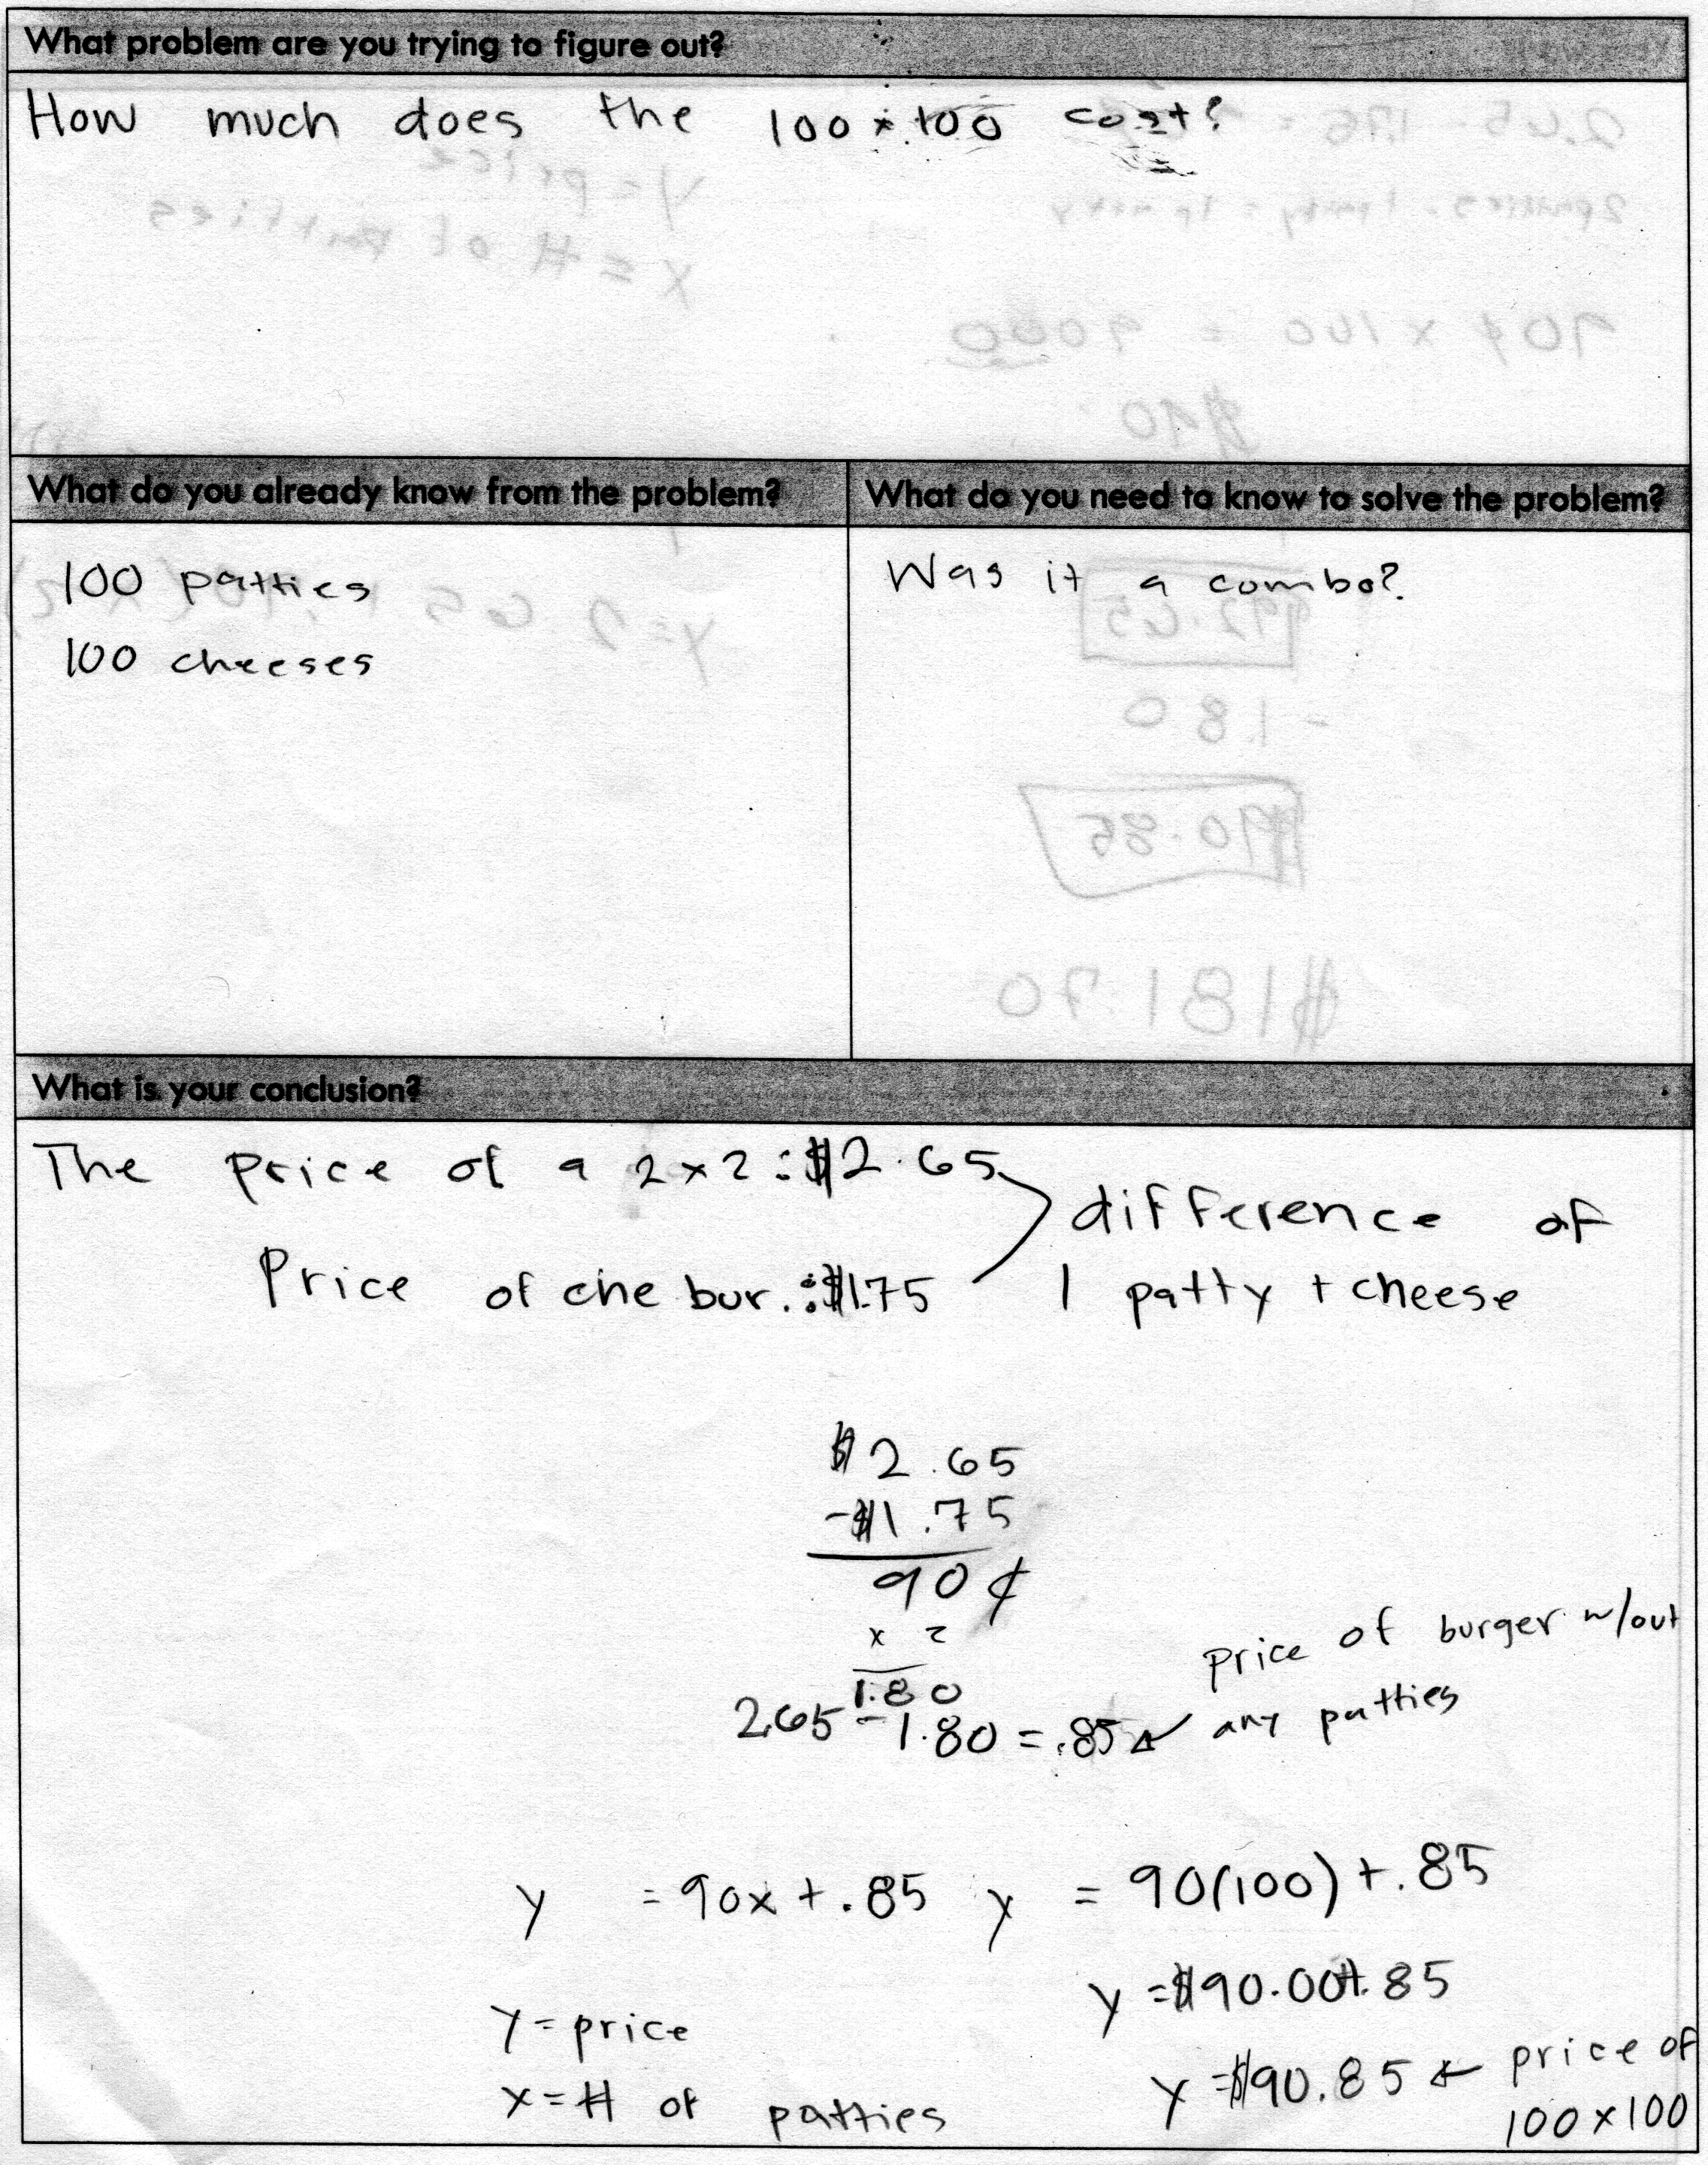
Something for students to aspire to would be to explain their solution using numbers (an input-output table), symbols (Algebra), pictures (graph), and words (a written explanation of how they approached the problem) which is CCSS F-LE.2. I have included an example of how that may look below. The most important part of the multiple representations is challenging students to explain connections between the representations. For example, where do you see the cost of the extra layer mentioned in the words in the table, graph, and symbols. What about the cost of the cheeseburger? Note that this is a discrete and not continuous function as you can only get whole number layers.
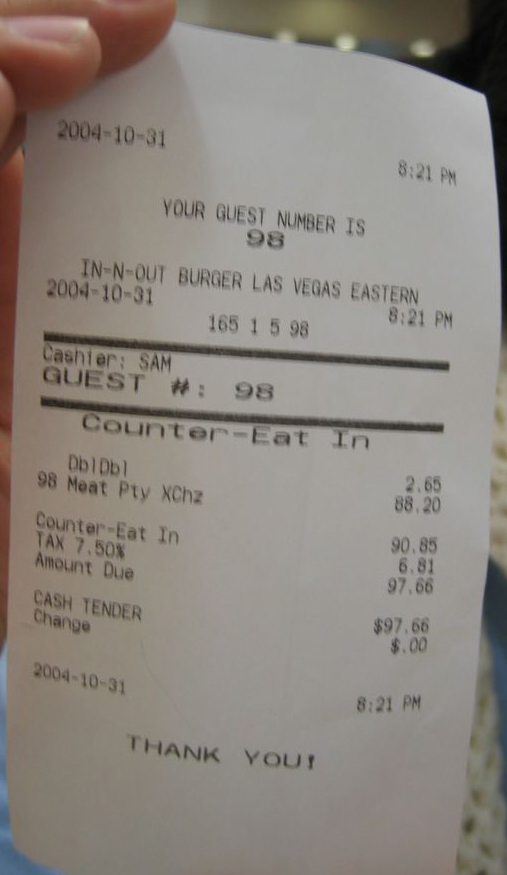
When it is time to show students the actual cost of the 100×100 burger, use this picture below which shows a price of $90.85. Note that their answer should be the “Counter-Eat In” amount and not the “Amount Due” unless you want to have them factor 7.5% sales tax into the cost. The way the order was entered, the customer was charged for a Double-Double plus 98 additional meat and cheese layers.
Something worth noting is that there are at least three correct equations for determining the cost of an NxN burger:
- .90(N-2) + 2.65 — The cost of a Double-Double plus N-2 additional layers at 90 cents a layer (since the Double-Double already had 2 layers)
- .90(N-1) + 1.75 — The cost of a cheeseburger plus N-1 additional layers at 90 cents a layer (since the cheeseburger already had 1 layer)
- .90N + 0.85 — The cost of the bun and produce plus N additional layers at 90 cents a layer (the $0.85 comes from subtracting the $0.90 per layer from a $1.75 cheeseburger)
Consider having a conversation with students about what happens when you simplify each of these expressions. Ask them to explain what each part of the expression means. Also, look out for students who get answers like .90N + 1.75 which don’t take into consideration the layers that are already on the cheeseburger.
To find the total number of calories, students should take the same approach but using nutritional information (below). I do not have the actual answers but they can be similarly extrapolated from the chart below (included in the “Download Files” link as a PDF). It appears that an extra layer of beef and cheese is 190 calories (670 calories – 480 calories). So, based on that assumption the calorie counts would be:
- 4×4 = 1,050 calories
- 20×20 = 4,090 calories
- 100×100 = 18,300 calories
- NxN = 480 + (N-1)*190 calories
What You’ll Need
- A picture of a cheeseburger (to establish that it has one cheese slice and one burger patty):
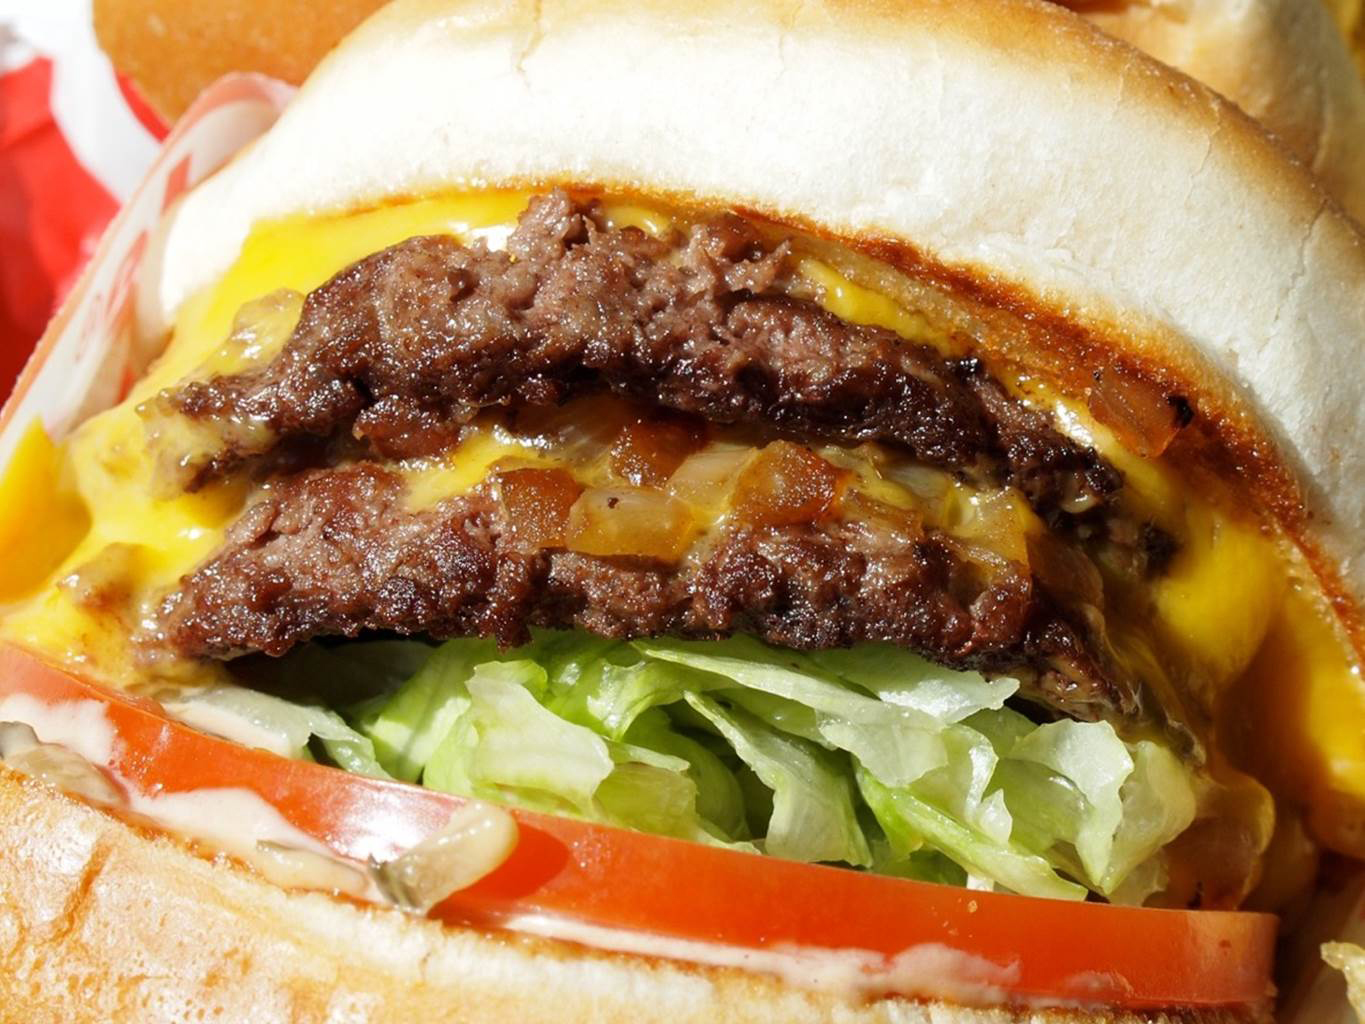
- A picture of a Double-Double (to establish that it has two cheese slices and two burger patties):
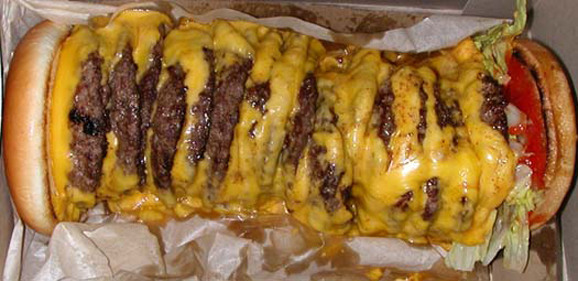
- A picture of a 20×20 burger (to establish that it has 20 cheese slices and 20 burger patties):
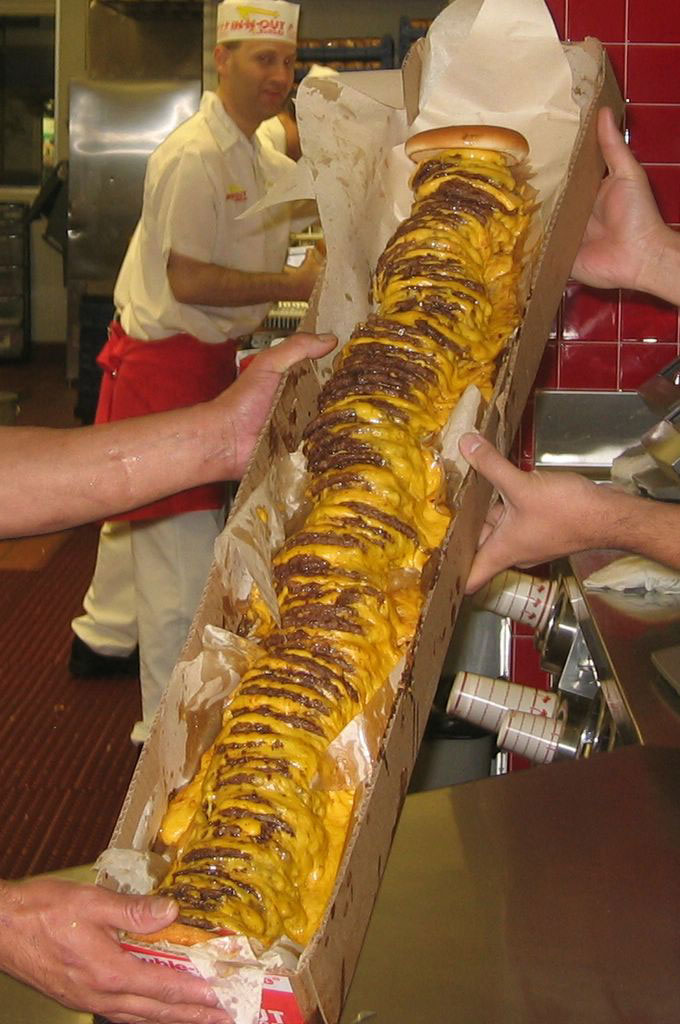
- A picture of a 100×100 burger:
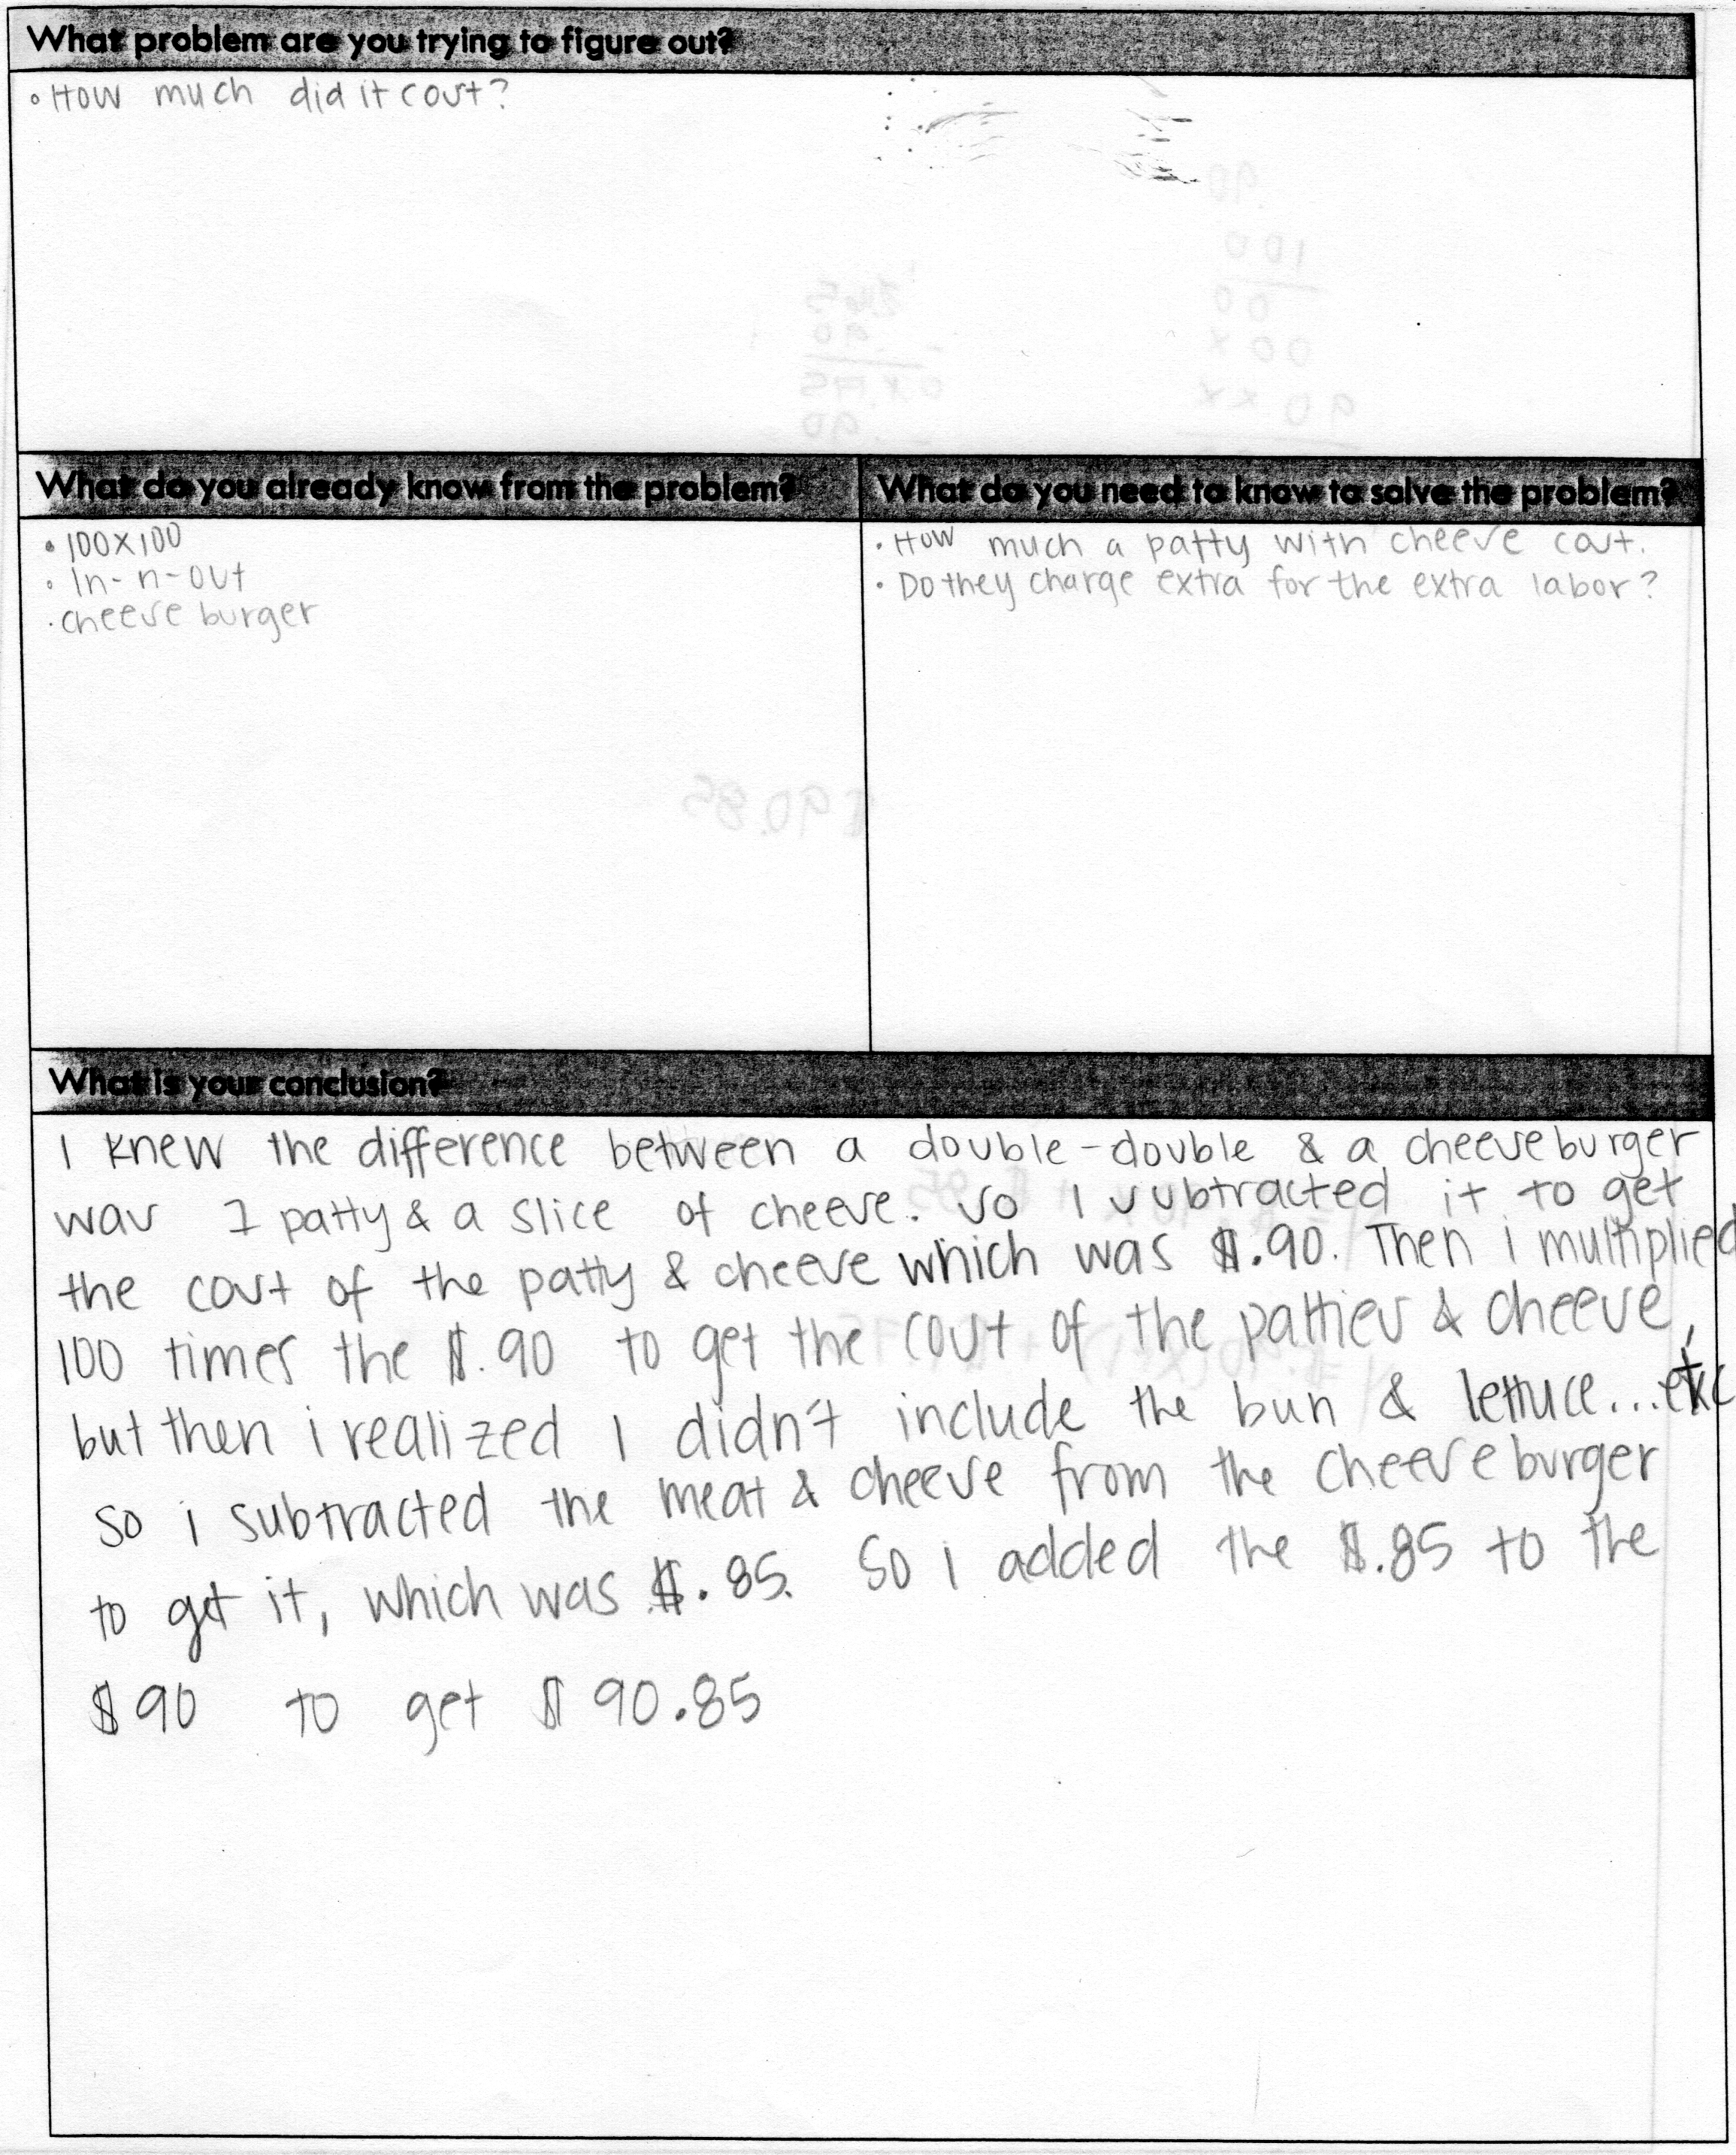
Student Work
Below are low, medium, and high work samples for the challenge.
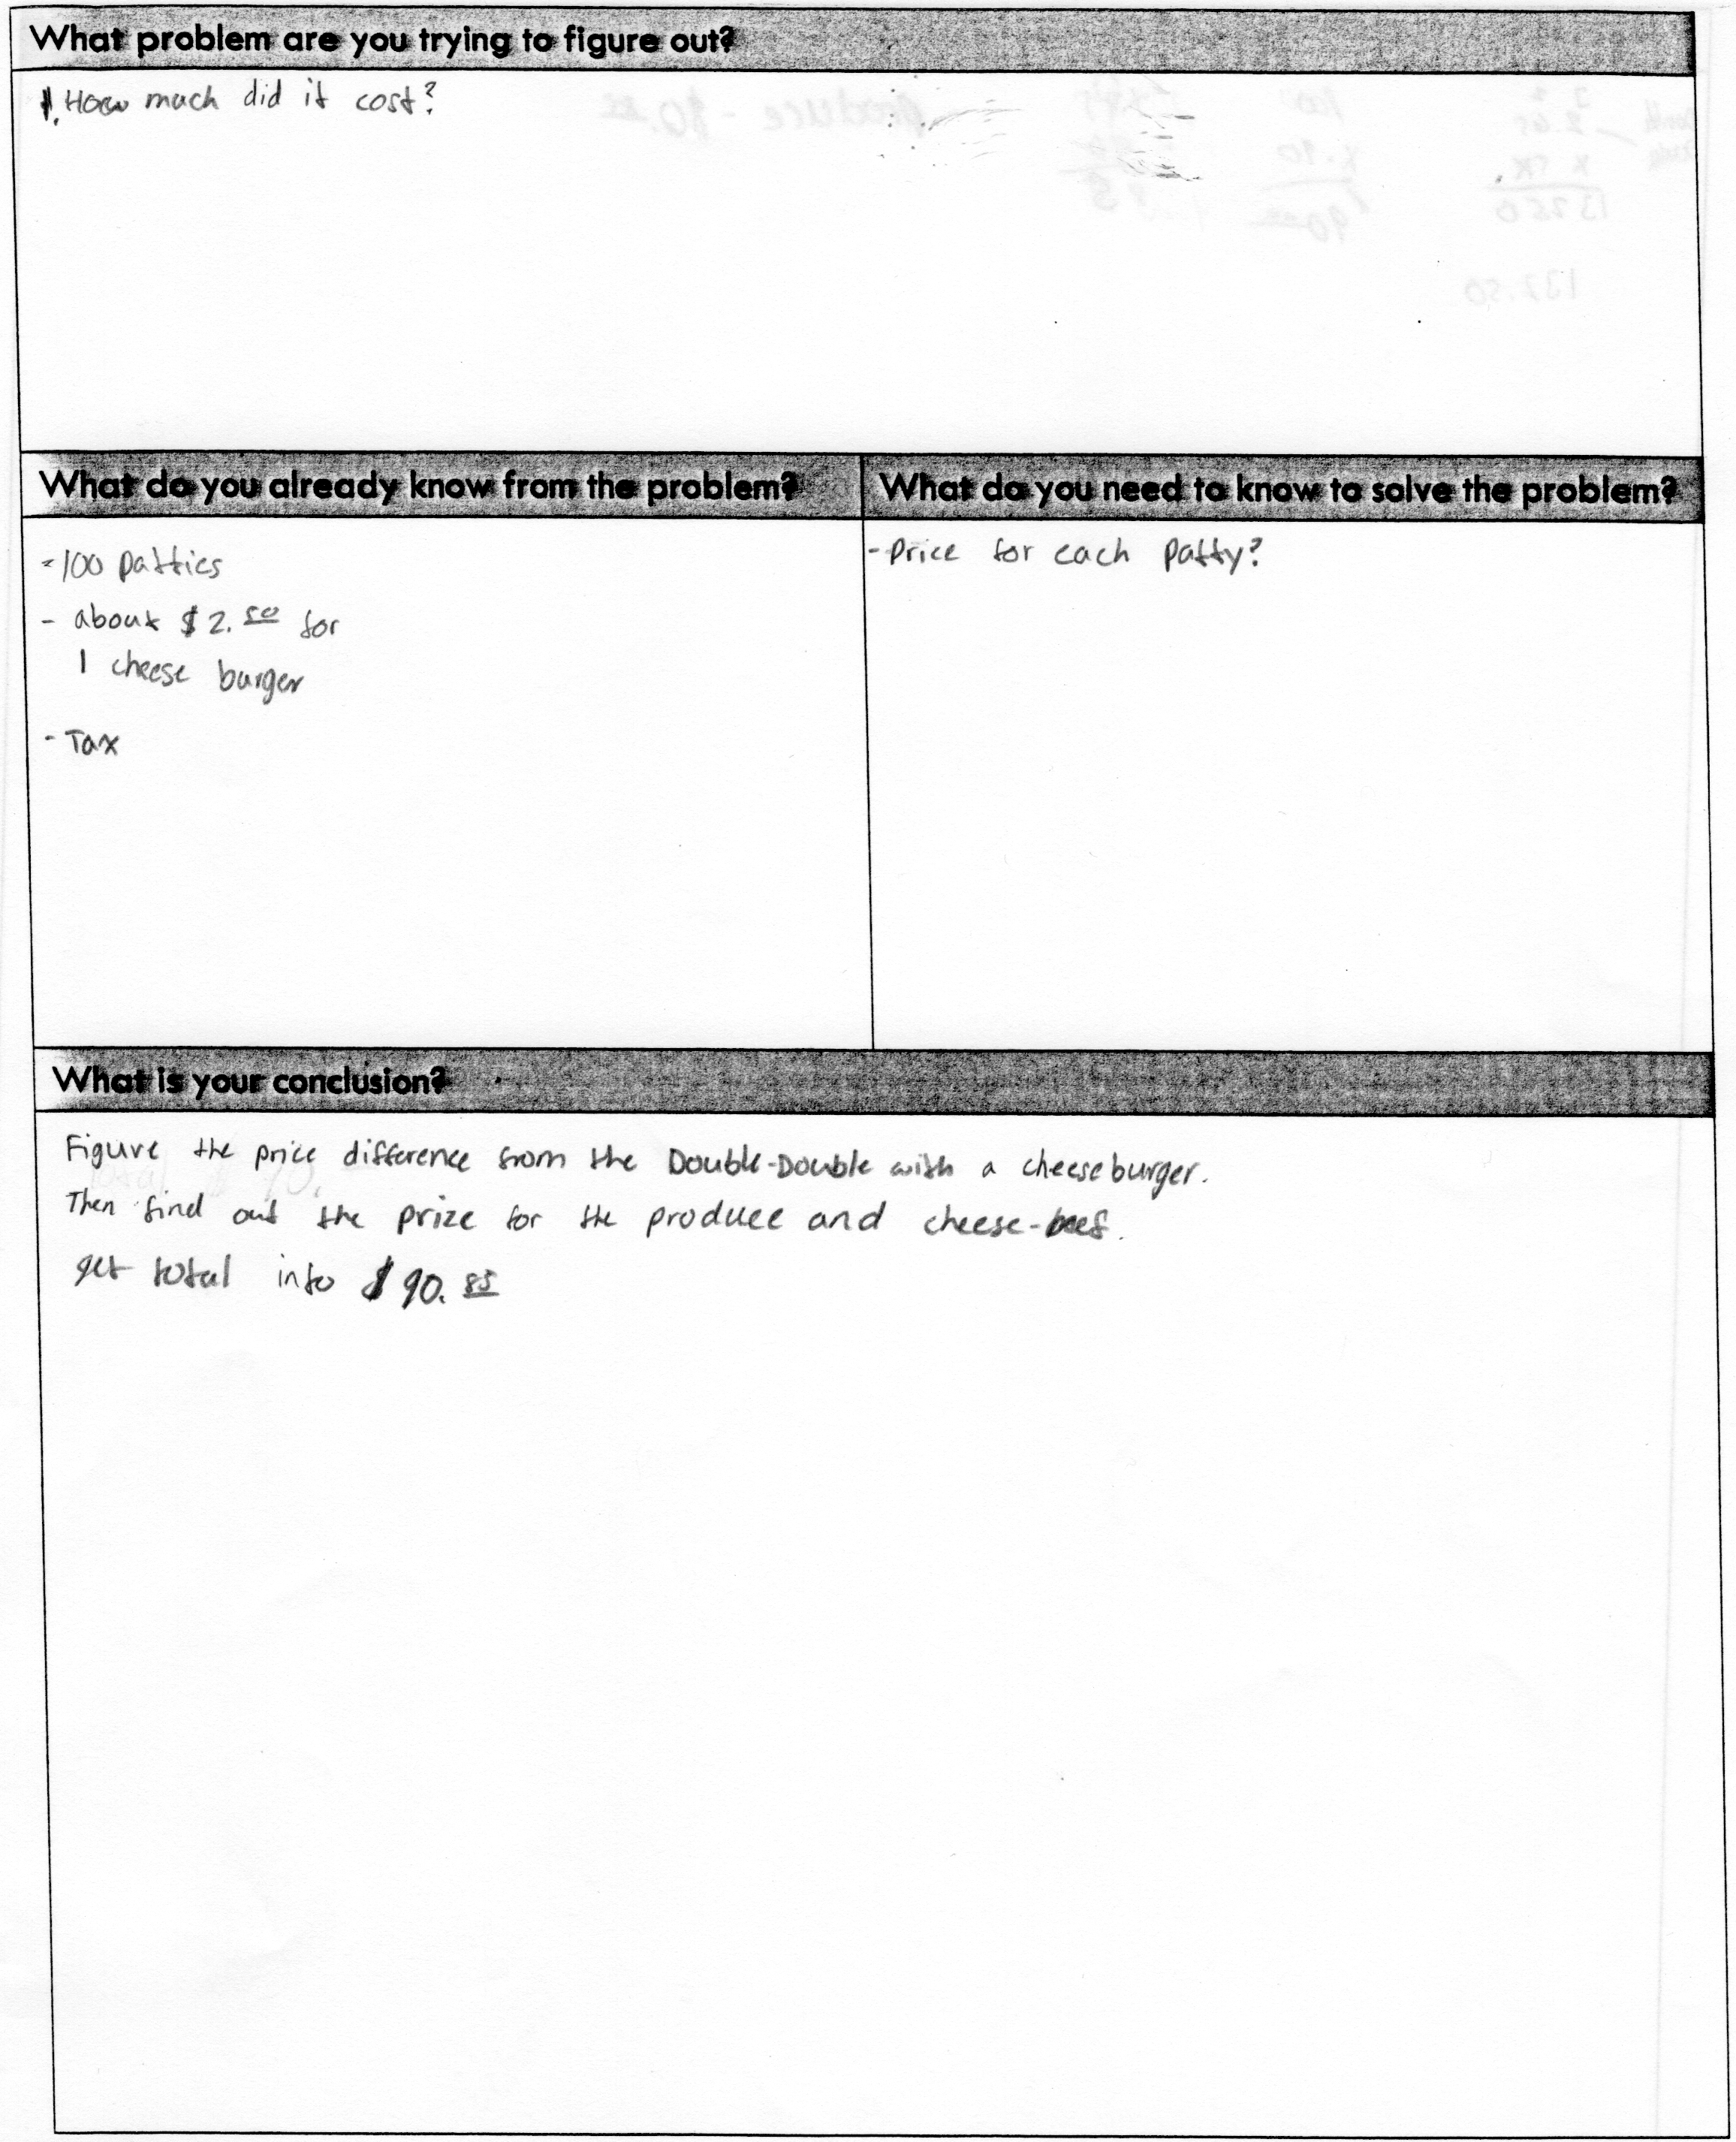
- Low
- Low
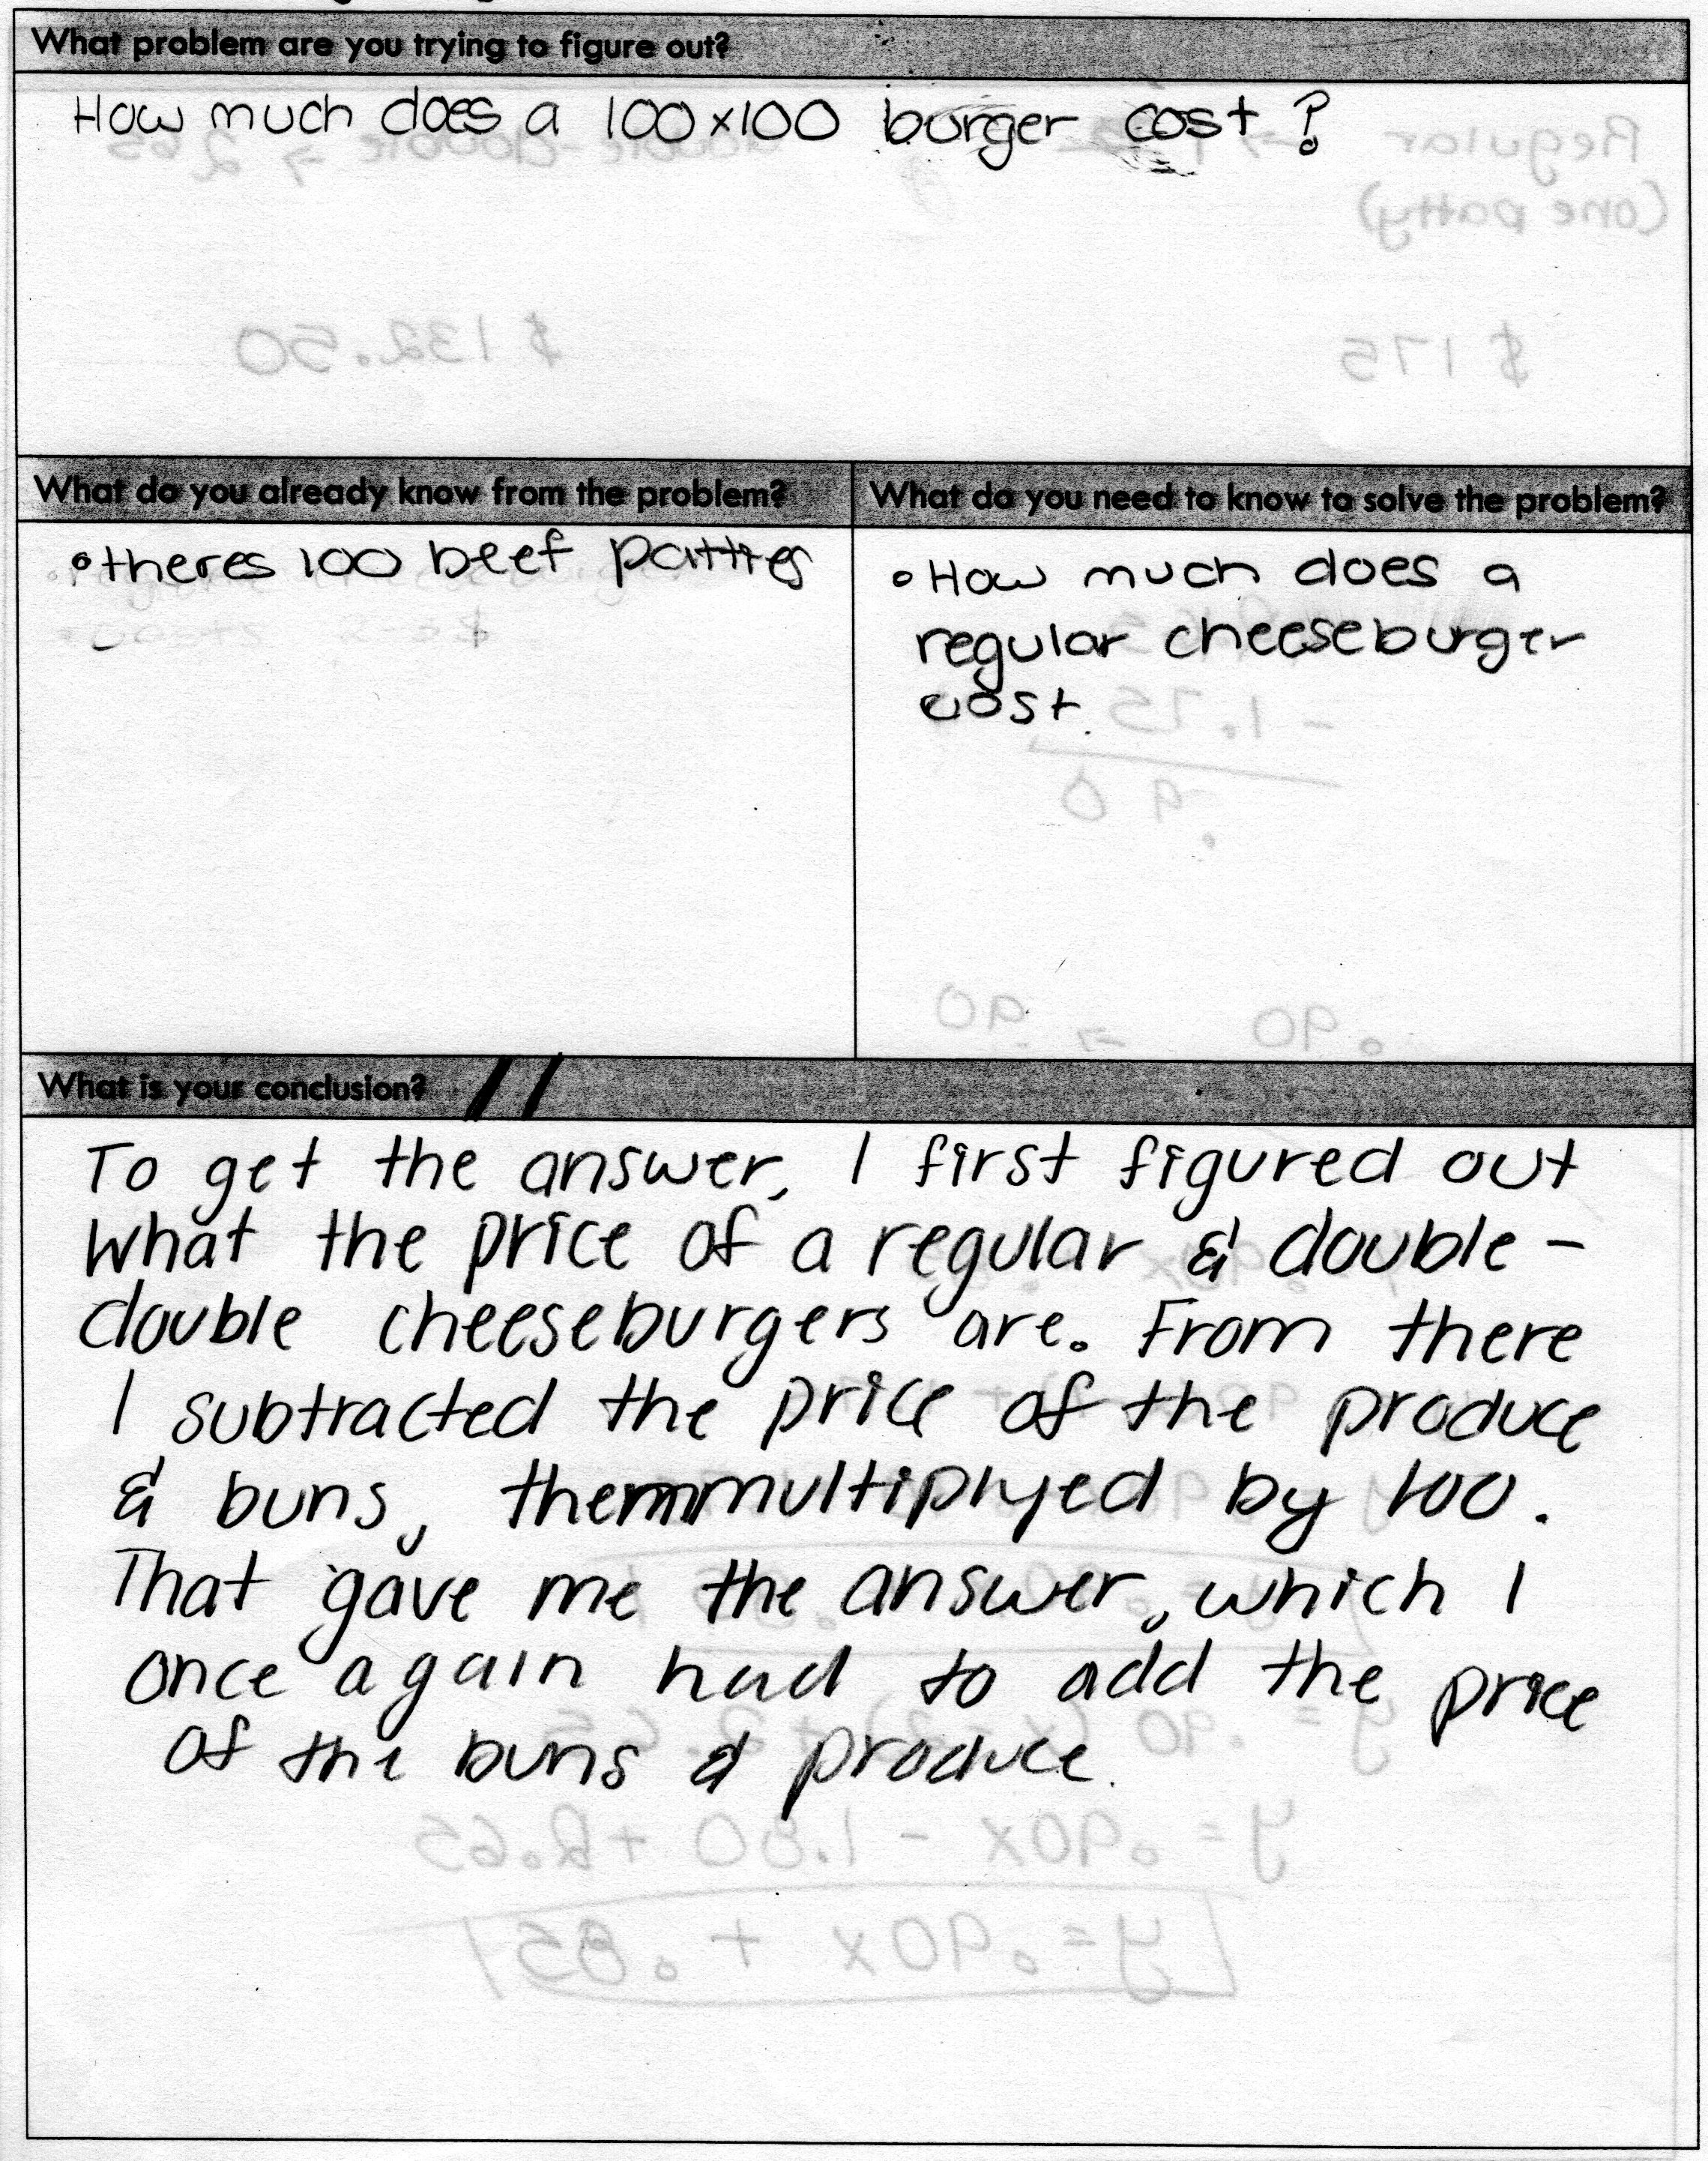
- Medium
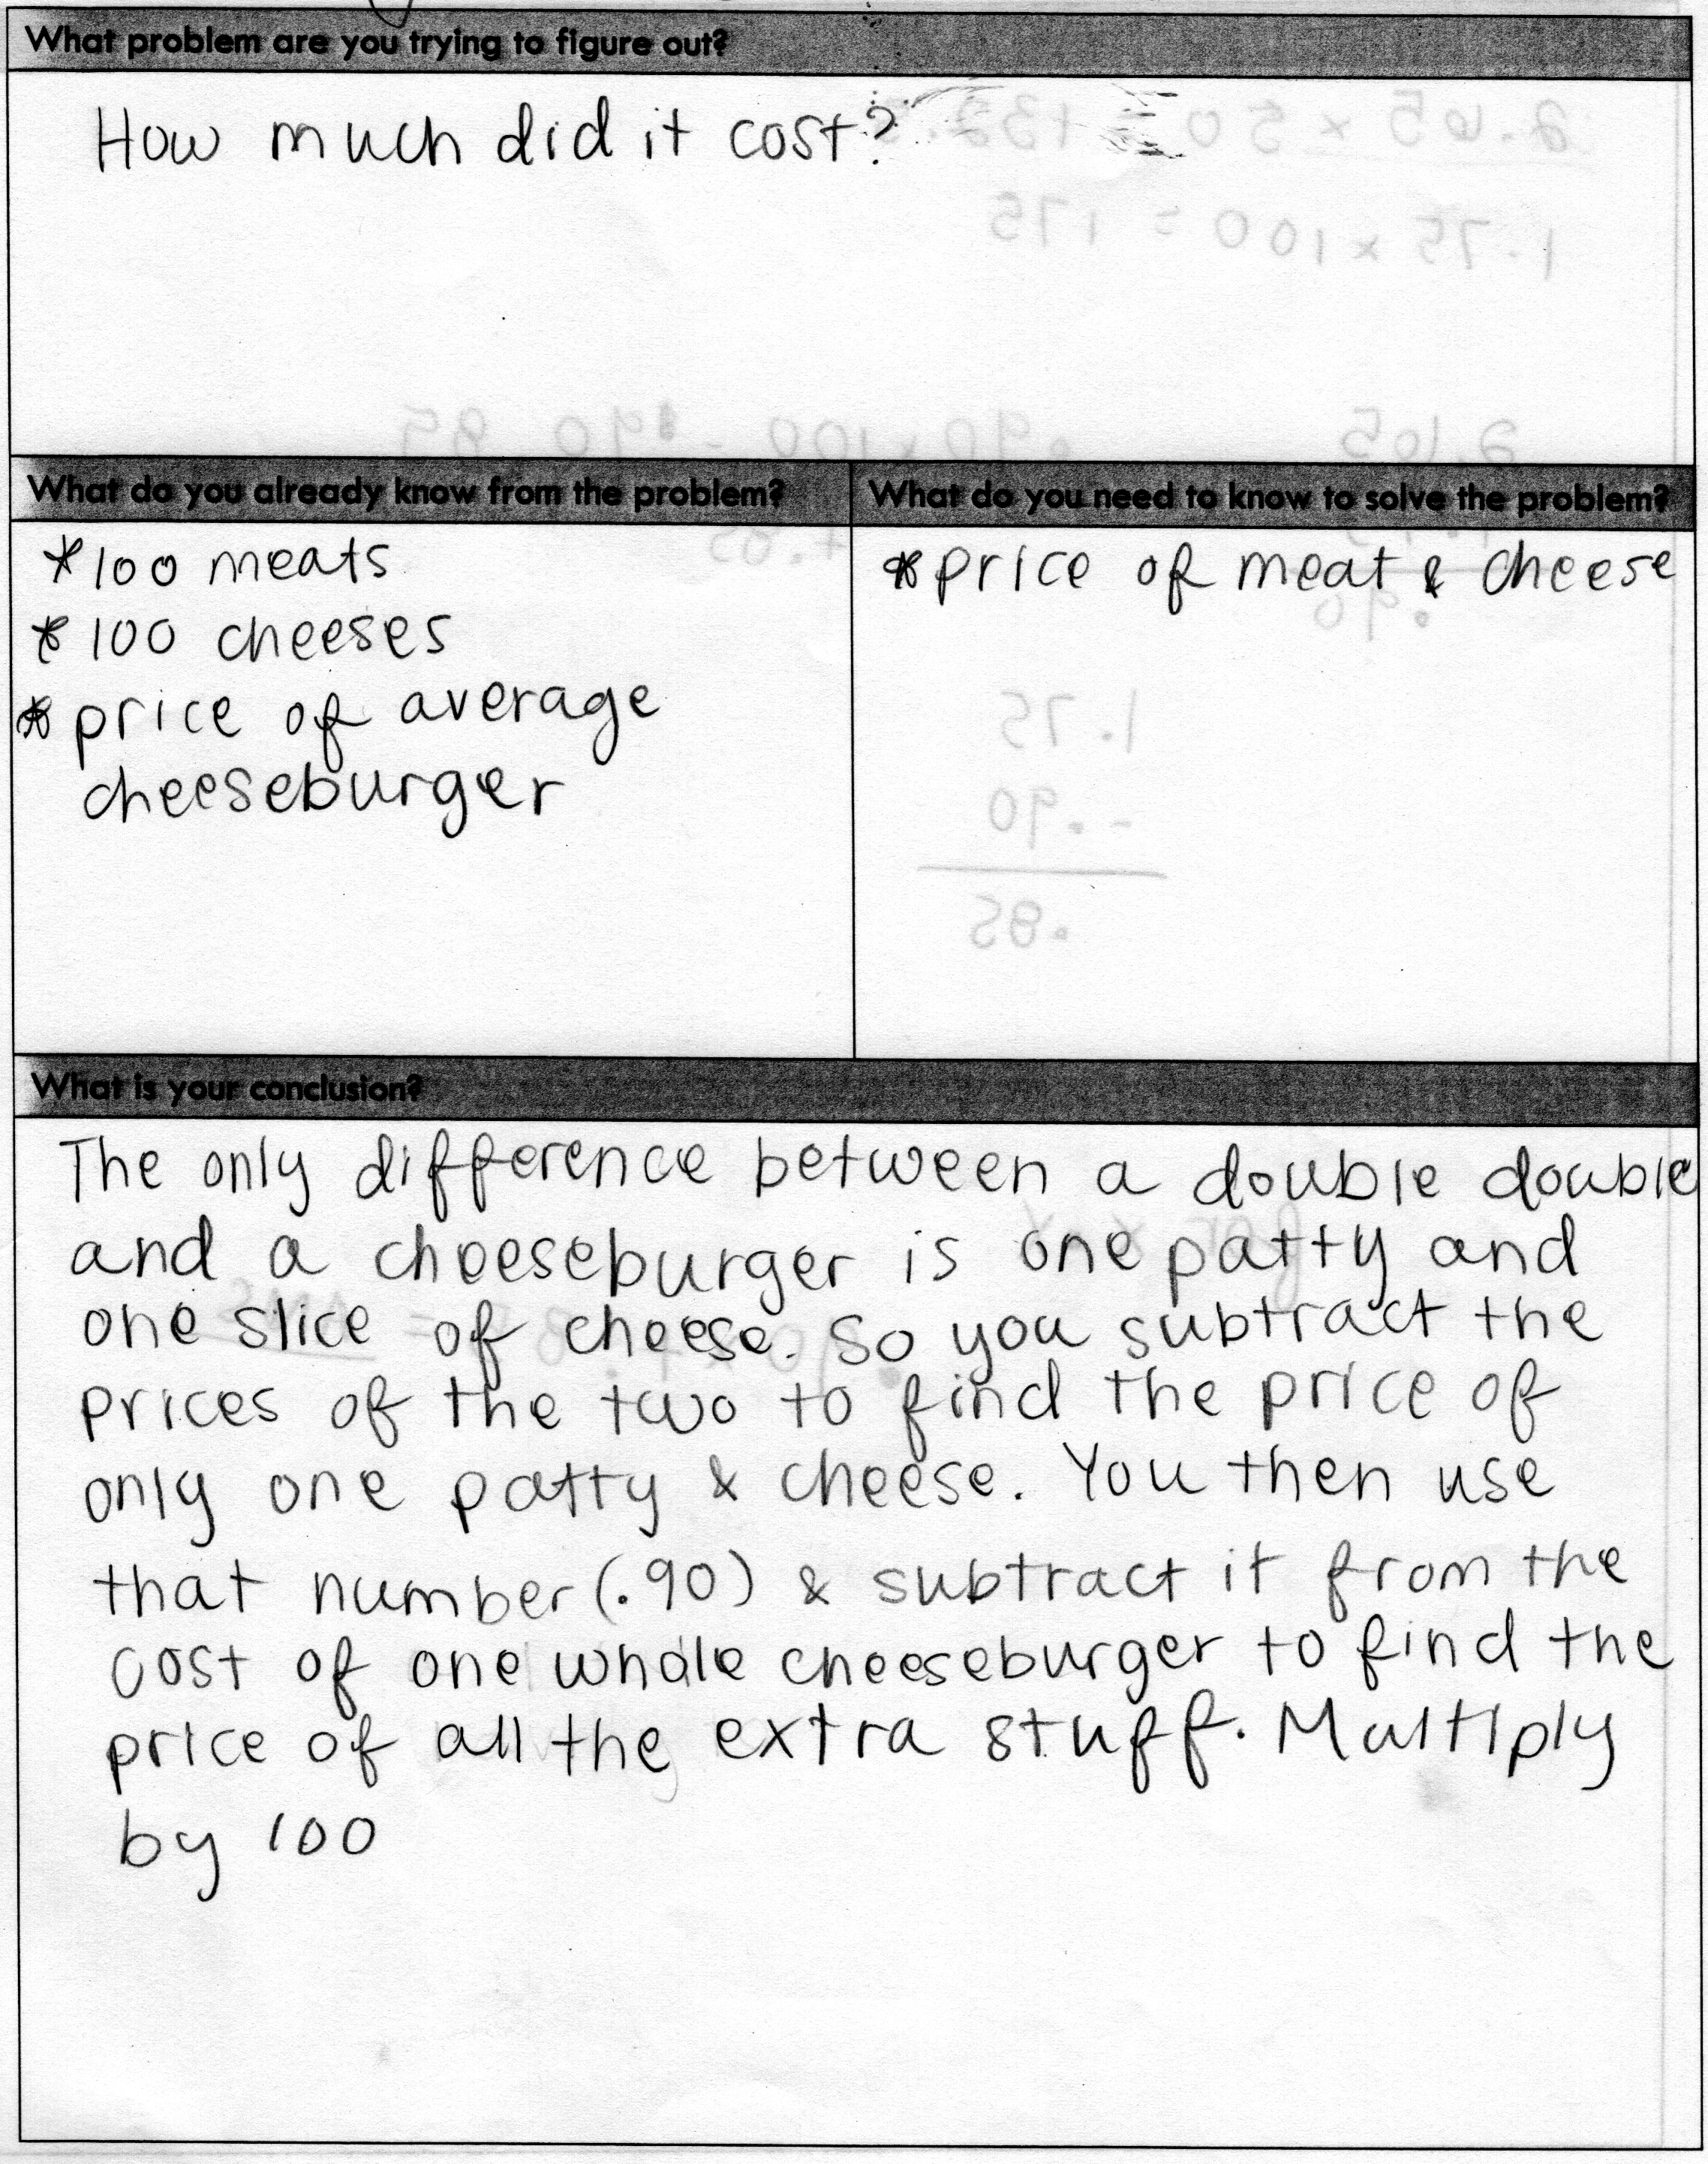
- Medium
- High
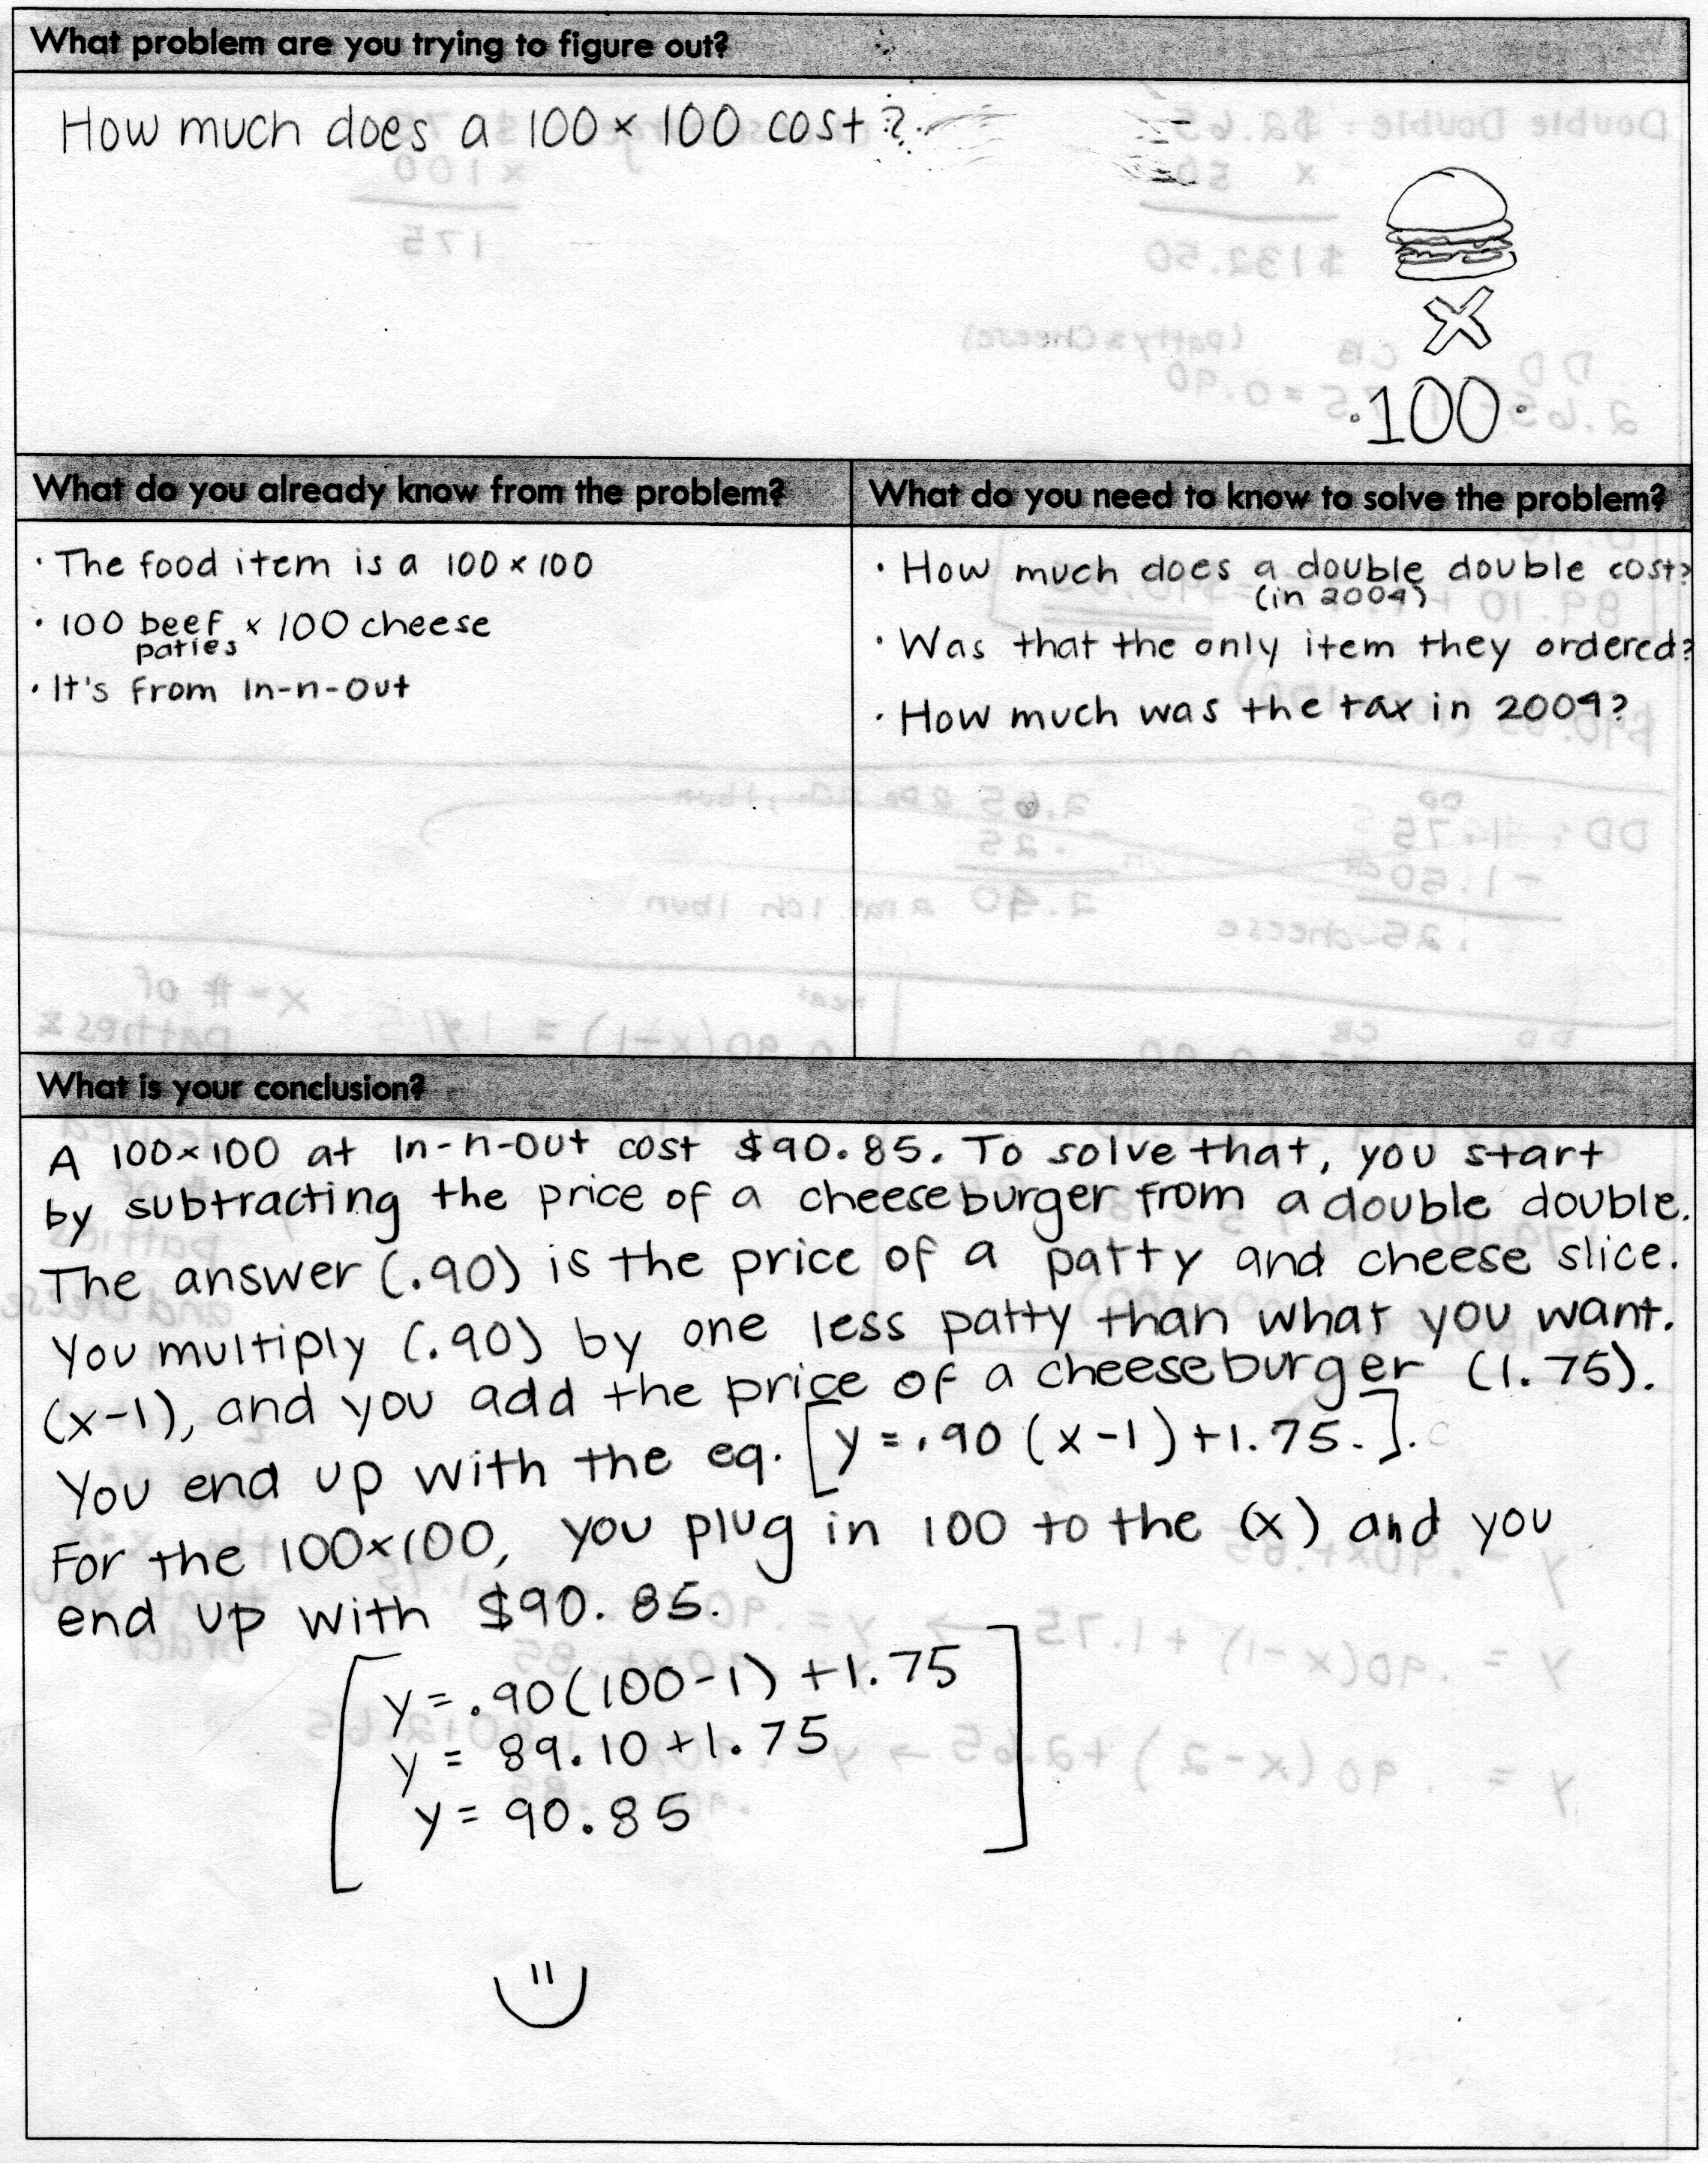
- High
Content Standard(s)
- CCSS 8.F.1 Understand that a function is a rule that assigns to each input exactly one output. The graph of a function is the set of ordered pairs consisting of an input and the corresponding output.
- CCSS 8.F.3 Interpret the equation y = mx + b as defining a linear function, whose graph is a straight line; give examples of functions that are not linear. For example, the function A = s2 giving the area of a square as a function of its side length is not linear because its graph contains the points (1,1), (2,4) and (3,9), which are not on a straight line
- CCSS 8.F.4 Construct a function to model a linear relationship between two quantities. Determine the rate of change and initial value of the function from a description of a relationship or from two (x, y) values, including reading these from a table or from a graph. Interpret the rate of change and initial value of a linear function in terms of the situation it models, and in terms of its graph or a table of values.
- CCSS 8.F.5 Describe qualitatively the functional relationship between two quantities by analyzing a graph (e.g., where the function is increasing or decreasing, linear or nonlinear). Sketch a graph that exhibits the qualitative features of a function that has been described verbally.
- CCSS F-IF.4 For a function that models a relationship between two quantities, interpret key features of graphs and tables in terms of the quantities, and sketch graphs showing key features given a verbal description of the relationship. Key features include: intercepts; intervals where the function is increasing, decreasing, positive, or negative; relative maximums and minimums; symmetries; end behavior; and periodicity.★
- CCSS F-IF.5 Relate the domain of a function to its graph and, where applicable, to the quantitative relationship it describes. For example, if the function h(n) gives the number of person-hours it takes to assemble n engines in a factory, then the positive integers would be an appropriate domain for the function.★
- CCSS F-IF.6 Calculate and interpret the average rate of change of a function (presented symbolically or as a table) over a specified interval. Estimate the rate of change from a graph.★
- CCSS F-IF.7 Graph functions expressed symbolically and show key features of the graph, by hand in simple cases and using technology for more complicated cases.★
- CCSS F-IF.7a Graph linear and quadratic functions and show intercepts, maxima, and minima.
- CCSS F-BF.1 Write a function that describes a relationship between two quantities.★
- CCSS F-BF.1a Determine an explicit expression, a recursive process, or steps for calculation from a context.
- CCSS F-LE.1b Recognize situations in which one quantity changes at a constant rate per unit interval relative to another.
- CCSS F-LE.2 Construct linear and exponential functions, including arithmetic and geometric sequences, given a graph, a description of a relationship, or two input-output pairs (include reading these from a table
- CCSS F-LE.5 Interpret the parameters in a linear or exponential function in terms of a context.
- CCSS A-CED.2 Create equations in two or more variables to represent relationships between quantities; graph equations on coordinate axes with labels and scales.
- CCSS A-CED.3 Represent constraints by equations or inequalities, and by systems of equations and/or inequalities, and interpret solutions as viable or nonviable options in a modeling context. For example, represent inequalities describing nutritional and cost constraints on combinations of different foods.
Source(s)
- http://www.whatupwilly.com/2006/01/in-n-out-100×100.html
- http://www.in-n-out.com/nutrition.aspx
- http://www.friedmanarchives.com/
Download