8.SP Animal Brains
Is there an association between the weight of an animal’s body and the weight of the animal’s brain?
-
Make a scatterplot using the following data.
Body and brain weight by animal. Source: http://mste.illinois.edu/malcz/DATA/BIOLOGY/Animals.html Animal Body Weight (kg) Brain Weight (g) Mountain beaver 1.35 465 Cow 465 423 Grey wolf 36.33 119.5 Goat 27.66 115 Guinea pig 1.04 5.5 Asian elephant 2547 4603 Donkey 187.1 419 Horse 521 655 Potar monkey 10 115 Cat 3.3 25.6 Giraffe 529 680 Gorilla 207 406 Human 62 1320 African elephant 6654 5712 Rhesus monkey 6.8 179 Kangaroo 35 56 Golden hamster 0.12 1 Mouse 0.023 0.4 Rabbit 2.5 12.1 Sheep 55.5 175 Jaguar 100 157 Chimpanzee 52.16 440 Mole 0.122 3 Pig 192 180 Do there appear to be outliers in this data? Which animals appear to be outliers? Explain how you identified these outliers.
Removing the outliers from the data set, make a new scatterplot of the remaining animal body and brain weights.
Does there appear to be a relationship between body weight and brain weight? If yes, write a brief description of the relationship.
Take a piece of uncooked spaghetti and use that spaghetti to informally fit a line to the data. Attempt to place your line so that the vertical distances from the points to the line are as small as possible.
How well does the spaghetti line appear to fit the data? Explain.
Solutions
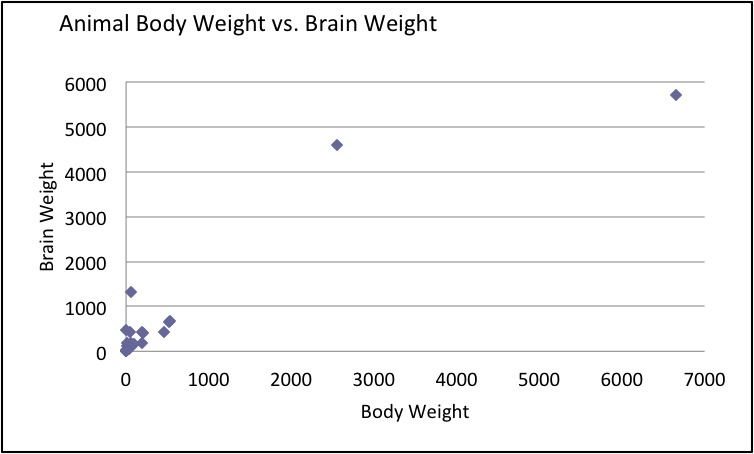
Yes there appear to be two outliers. The outliers are the African Elephant and the Asian Elephant. The points corresponding to these two animals are very far away from the rest of the data.
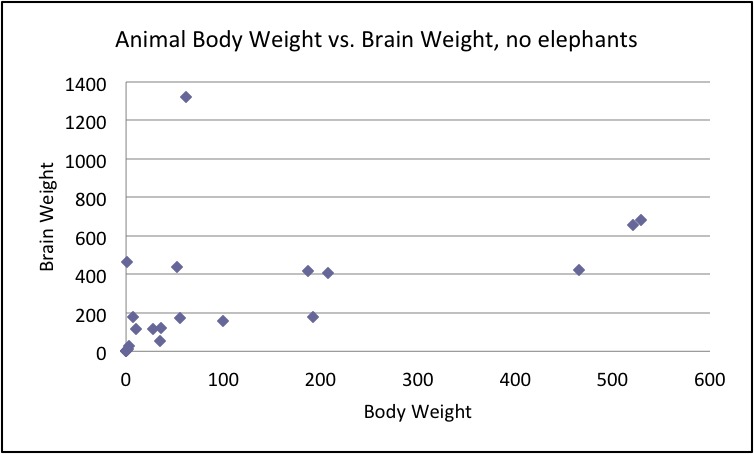
Yes, there appears to be a relationship between body weight and brain weight of animals. The relationship looks roughly linear and the relationship is positive. Larger brain weights tend to be paired with larger body weights.
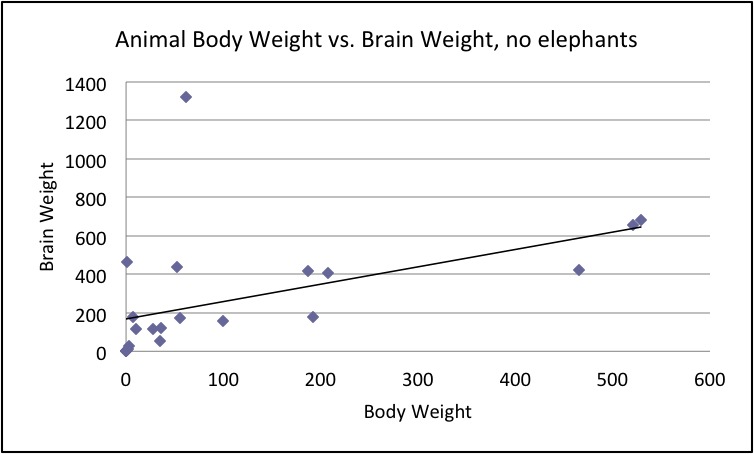
The spaghetti line fits the data fairly well although the human has a brain weight that is very large given the weight of the body.
Commentary
This task is designed as an instructional task. You will need to provide each student with a piece of uncooked spaghetti.
The purpose of this task is for students to create scatterplots, and think critically about associations and outliers in data as well as informally fit a trend line to data. This task provides an example of how students could informally fit a line to bivariate data without using technology to “magically” make the line appear. By using spaghetti rather than drawing a line, students can easily make adjustments on the placement of the line. They can also easily see points on both sides of the line as they are trying to fit the line to the data.