5.G Meerkat Coordinate Plane Task
Greetings from the Kalahari Desert in South Africa! In this activity, you will learn a lot about the Kalahari’s most playful residents: meerkats.
- The following ordered pairs show the height of a typical meerkat at different times during the first 20 months of life. Graph the corresponding points and see what you can discover about meerkats. Once you have graphed them all, connect the points in the order they are given to form a line graph.
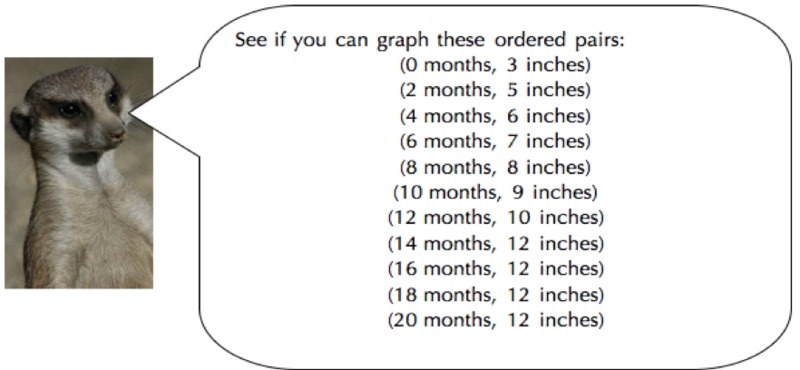

- What does the point (0 months, 3 inches) mean for a typical meerkat's height?
- How tall do you think a typical meerkat gets? Why?
- At what age do meerkats reach their full height? How do you know from this graph?
- If this graph were about a human instead of a meerkat, at what age do you think the height would stop getting larger?
Solutions
Solution: 1
-

- The point (0 inches, 3 months) means that when a meerkat is first born, it is typically 3 inches in height.
- The graph shows that meerkats grow to about 12 inches tall because none of the points given has a \(y\) value greater than 12. It looks like the meerkat has stopped growing.
- Meerkats stop growing at about 14 months old. At that point, time continues to pass, but meerkats stay about 12 inches tall.
- Answers may vary, but most students will predict that humans usually stop growing at about 17 years old.
Commentary
The purpose of this task is for students to answer questions about a problem situation by drawing and interpreting the meaning of points that are in the first quadrant of the coordinate plane. This task helps to pave the way for later work interpreting the meaning of the \(y\)-intercept and rates of change in a real-world context.
The task ends by asking students to predict how this same graph might relate to humans. Though there is just one question asking students to connect this graph to humans, there are many related follow-up questions to ask students as well such as,
“At 0 months, how tall do you think a human would be?”
“Would we want to use inches and months as our units in a graph of human height over time? If not, what units would be better?”
“What would be the maximum \(y\)-value for the typical human?”
“What would be the maximum \(y\)-value for the typical NBA player?”