S-ID.6 Used Subaru Foresters I
Jane wants to sell her Subaru Forester, but doesn’t know what the listing price should be. She checks on craigslist.com and finds 22 Subarus listed. The table below shows age (in years), mileage (in miles), and listed price (in dollars) for thesse 22 Subarus. (Collected on June 6th, 2012 for the San Francisco Bay Area.)
| Age | Mileage | Price |
|---|---|---|
| 8 | 109428 | 12995 |
| 5 | 84804 | 14588 |
| 3 | 55321 | 20994 |
| 3 | 57474 | 18991 |
| 1 | 11696 | 19981 |
| 13 | 125260 | 6888 |
| 10 | 67740 | 9888 |
| 11 | 97500 | 6950 |
| 6 | 36967 | 19700 |
| 12 | 148000 | 3995 |
| 2 | 29836 | 18990 |
| 3 | 32349 | 21995 |
| 10 | 161460 | 5995 |
| 4 | 68075 | 12999 |
| 3 | 30007 | 22900 |
| 8 | 66000 | 13995 |
| 10 | 93450 | 8488 |
| 3 | 35518 | 22995 |
| 3 | 30047 | 20850 |
| 8 | 107506 | 11988 |
| 11 | 89207 | 8995 |
| 13 | 141235 | 5977 |
- Make appropriate plots with well-labeled axes that would allow you to see if there is a relationship between price and age and between price and mileage. Describe the direction, strength and form of the relationships that you observe. Does either mileage or age seem to be a good predictor of price?
- If appropriate, describe the strength of each relationship using the correlation coefficient. Do the values of the correlation coefficients agree with what you see in the plots?
- Pick the stronger relationship and use the data to find an equation that describes this relationship. Make a residual plot and determine if the model you chose is a good one. Write a few sentences explaining why (or why not) the model you chose is appropriate.
- If Jane’s car is 9 years old with 95000 miles on it, what listing price would you suggest? Explain how you arrived at this price.
Solutions
-
Since all variables are quantitative, we can make two scatterplots. It makes sense to choose price as the response variable in both scatterplots, with age and mileage as the explanatory variable.
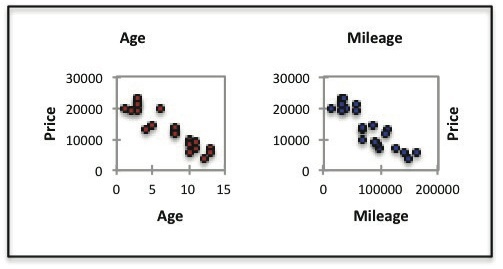
Both scatterplots show a strong negative linear trend. As age increases, price tends to decrease. As mileage increases, price tends to decrease. Both age and mileage seem to be good predictors of price.
- Since the scatterplots show linear relationships, it is appropriate to find the values of the correlation coefficients. Since we see a strong negative linear relationship we expect them to be negative and close to -1. Using technology, we find the value of the correlation coefficient for age and price to be -0.9251. The value of the correlation coefficient for mileage and price is -0.8995.
-
The relationship between price and age is slightly stronger than the relationship between price and mileage, so this solution gives the regression equation for price vs. age. But since the values of the correlation coefficients are very close, the student could choose either age or mileage as a predictor. Since the scatterplot looks linear and the correlation is strong, we can find a linear model:
$$ \text{predicted price} = 24,247.56 -1482.06 \text{ age} $$We can also use technology to find the residual plot.
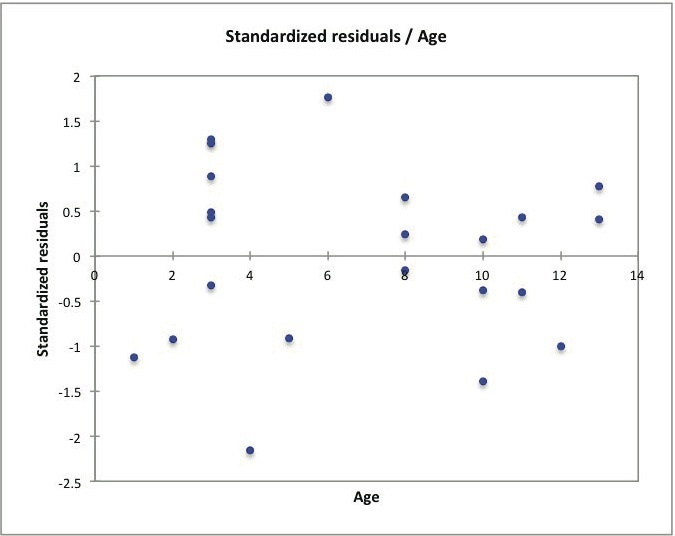
Residual plots show us where the model has overestimated the values of cars (where residuals are negative) and where the model has underestimated the values of cars (positive residuals). If the pattern is truly linear, the residual plot should show no pattern and should be a random scattering of points. We see an example of that here. Since the original scatterplot of price vs. age looks straight, since the correlation is strong and since the residual plot shows no obvious pattern, our linear model is appropriate and can be used to make predictions.
- Since we determined that age is a slightly better predictor than mileage, we use the linear model for predicting price based on age found in part (c). Plugging in Jane’s information using \(\text{age} = 9\), we compute her predicted list price to be approximately $10,909.
Commentary
This problem could be used for either a lesson or an assessment, or it could be adapted to a take-home project where students pick a product, collect data, and examine predictors for price.
If this is being used as an introductory lesson, more scaffolding would be needed to lead students to the solution in part (a) that two scatterplots would be the right plots to make. In general, students have a hard time deciding what is an appropriate display for data. In this problem they have to determine that the variables are quantitative, and that a scatterplot is a nice way to display a relationship between two quantitative variables. Once they have made scatterplots of price versus mileage and price versus age, they need to practice verbalizing what they observe by describing direction and strength, as well as a form such as linear or quadratic.
Both price versus mileage and price versus age scatterplots show a strong linear relationship. The appropriateness of a linear model can be confirmed by making a residual plot – the residual plot shows no pattern that would indicate that a linear model might not be an appropriate way to describe the realtionship. Note that there are several common forms for residual plots. It would be appropriate to plot residuals or standardized residuals versus either the explanatory variable or the predicted values. The form of the plot will be similar for any of these residual plots.
Although technology makes dealing with a data set this size much easier, the problem could be done by hand as well. You might want to reduce the number of data points used. Once the scatterplot is sketched, students can practice approximating the least squares regression line with a line fitted "by eye". Residuals can also be measured and plotted by hand in this case.