8.F Distance
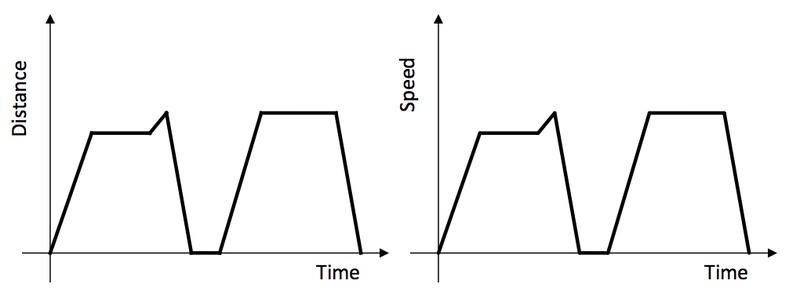
Below are two graphs that look the same. Note that the first graph shows the distance of a car from home as a function of time and the second graph shows the speed of a different car as a function of time. Describe what someone who observes the car’s movement would see in each case.
Solutions
For the distance function, output values tell us how far from home the car is. For a speed function, output values tell us how fast the car is moving. Since we don’t have scales on either axis, we can’t talk about specific values of time, distance and speed, but we can make qualitative statements about distance and speed.
Distance Graph: The car starts its trip at home. It moves away from home at a constant rate. When the graph is horizontal, the car's distance from home is not changing, which probably means it has come to a stop for awhile.* Then the car moves farther away from home before turning around and coming back home. After staying at home for a time, the car moves away from home at a constant rate. It comes to a stop for a while* before coming back home.
*If the distance from home is not changing, it is also possible that the car is driving along a circle with the driver's home at the center.
Speed Graph: The car starts at rest and speeds up at a constant rate. When the graph becomes a horizontal line, the car is maintaining its speed for a while before speeding up for a short time and then quickly slowing down until it comes to a complete stop. It stays stationary for a little while where the graph is on the horizontal axis. Then the car speeds up, goes at a constant speed for a while and then slows down and comes to a complete stop.
Commentary
In this task students interpret two graphs that look the same but show very different quantities. The first graph gives information about how fast a car is moving while the second graph gives information about the position of the car. This problem works well to generate a class or small group discussion. Students learn that graphs tell stories and have to be interpreted by carefully thinking about the quantities shown.