8.SP Birds' Eggs
This scatter diagram shows the lengths and widths of the eggs of some American birds.
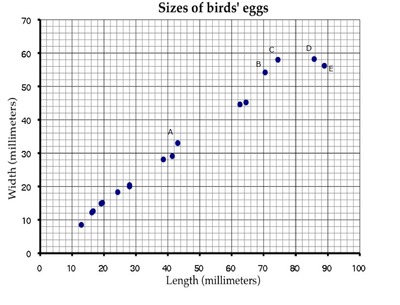
- A biologist measured a sample of one hundred Mallard duck eggs and found they had an average length of \(57.8\) millimeters and average width of \(41.6\) millimeters. Use an X to mark a point that represents this on the scatter diagram.
- What does the graph show about the relationship between the lengths of birds' eggs and their widths?
- Another sample of eggs from similar birds has an average length of \(35\) millimeters. If these bird eggs follow the trend in the scatter plot, about what width would you expect these eggs to have, on average?
- Describe the differences in shape of the two eggs corresponding to the data points marked C and D in the plot.
- Which of the eggs A, B, C, D, and E has the greatest ratio of length to width? Explain how you decided.
Solutions
Solution: Solution
-

- There seems to be a positive linear relationship between the length and with of the eggs.
- The line below appears to fit the data fairly well:
Since it passes through \((0,0)\) and \((50,36)\), it's slope is \(\frac{36}{50} = 0.72\), so the equation of the line is $$y=0.72x$$ If \(x=35\), then our line would predict that \(y=0.72\cdot 35 = 25.2\). So we would expect the width of these eggs to be, on average, about 25 mm. Answers using different lines can vary up to 1 mm in either direction.
- Without reading off precise numerical values from the plot, we can see that eggs \(C\) and \(D\) have very nearly the same width, but egg \(D\) is about 12 millimeters longer than egg \(C\).
- First we note that egg \(E\) certainly has a higher length-to-width ratio than \(C\) or \(D\), since it is both longer and narrowed. Similarly, \(E\) has a higher ratio than \(B\) because it is significantly longer, and only a tad wider. It is harder to visually identify the difference between \(A\) and \(E\), we compute their respective length-to-width ratios numerically, which turn out to be approximately \(1.3\) for \(A\) and \(1.6\) for \(E\). So \(E\) has the greatest ratio of length to width.
Commentary
This task asks students to glean contextual information about bird eggs from a collection of measurements of said eggs organized in a scatter plot. In particular, students are asked to identify a correlation and use it to make interpolative predictions, and reason about the properties of specific eggs via the graphical presentation of the data.
This task is based on a task developed by the MARS/ Shell Centre team Mathematics Assessment Resource Service. The task is shared with the with attribution, non-commercial, share-alike Creative Commons License.