Mendelian Inheritance
Article objectives
A Mendelian trait is a trait that is controlled by a single gene that has two alleles. One of these alleles is dominant and the other is recessive. Several inheritable conditions in humans are passed to offspring in a simple Mendelian fashion. Medical professionals use Mendel’s laws to predict and understand the inheritance of certain traits in their patients. Also, farmers, animal breeders, and horticulturists who breed organisms can predict outcomes of crosses by understanding Mendelian inheritance.
Calculating Probability
The rules of probability that apply to tossing a coin or throwing a dice also apply to the laws of segregation and independent assortment. Probability is the likelihood that a certain event will occur. It is expressed by comparing the number of events that occur to the total number of possible events. The equation is written as:
Probability = (number of times an event is expected to occur/total number of times an event could happen)
For example, in Mendel’s \(F_2\) hybrid generation, the dominant trait of purple flower color appeared 705 times, and the recessive trait appeared 224 times. The dominant allele appeared 705 times out of a possible 929 times (705+224=929).
Probability = (705/929)
(705/929)= 0.76
Probability is normally expressed in a range between 0 and 1, but it can also be expressed as a percentage, fraction, or ratio. Expressed as a percentage, the probability that a plant of the \(F_2\) generation will have purple flowers is 76%. Expressed as a fraction it is about ¾,and as a ratio it is roughly 3:1. The probability of the expression of the dominant allele for other characteristics can also be calculated the same way. In fact, Mendel found that all the other dominant “factors” had approximately a ¾ probability of being expressed in the \(F_2\) hybrid generation. Review Table 1 for the results for the other six characteristics.
Table 1 The Seven Characteristics Mendel Studied and Their Contrasting Traits
| Flower Color | Flower Position on Stem | Stem Length | Pod Shape | Pod Color | Seed Shape | Seed Color |
|---|---|---|---|---|---|---|
| violet-red (purple) | axial | tall | inflated | green | round | green |
| white | terminal | short | constricted | yellow | wrinkled | yellow |
The probability the recessive trait will appear in the \(F_2\) hybrid generation is calculated in the same way.
Probability = (224/929)
(224/929) = 0.24
The probability of the recessive trait appearing in the \(F_2\) generation is 24% or about ¼. Results predicted by probability are most accurate when many trials are done. The best way to illustrate this idea is to toss a coin. Because a coin has two sides, every time you toss it the chance of tossing heads or tossing tails is 50%. The outcome of each separate toss is unaffected by any previous or future result. For example, imagine you tossed seven heads in a row. You would think that the next toss is more likely to be a tail, but the possibility of tossing another head is still 50%. If you tossed the coin a total of ten times, a total of seven heads and three tails, you would calculate the probability of tossing heads is 70%. The fact that you carried out only a small number of trials has affected your results. If Mendel had grown only 10 plants, he would have gotten different probabilities for the appearance of dominant and recessive traits. However, Mendel carried out many thousands of trials. He was therefore sure that his results were due to probability, and not to chance.
Probability and the Law of Segregation
Each coin toss is a separate event. Likewise, gamete formation is a separate event. The probability that a Pp heterozygote produces gametes with a P allele or a p allele is 50% for each gamete cell. In a fertilization involving two such plants (as in the \(F_1\) generation self-pollination experiment), each pollen cell and each egg cell have a 50% chance of having the P or p allele.
Predicting Genotypes with Punnett Squares
Mendel developed the law of segregation by following only a single characteristic, such as pod color, in his pea plants. Biologists use a diagram called a Punnett Square, to help predict the probable inheritance of alleles in different crosses. In a monohybrid cross, such as the one in Figure 1, the Punnett square shows every possible combination when combining one maternal (mother) allele with one paternal (father) allele. In this example, both organisms are heterozygous for flower color Pp (purple). Both plants produce gametes that contain both the P and p alleles. The probability of any single offspring showing the dominant trait is 3:1, or 75%.

Figure 1: A Punnett square helps determine the genotype of this heterozygous cross. Two pea plants, both heterozygous for flower color, are crossed. The offspring will show the dominant purple coloration in a 3:1 ratio. Or, about 75% of the offspring will be purple.
Using Probability in Heterozygous Cross
We can calculate the probability of any one of the offspring being heterozygous (Pp) or homozygous (PP or pp) for flower color. The probability of a plant inheriting the P or p allele from a heterozygous parent is ½. Multiply the probabilities of inheriting both alleles to find the probability that any one plant will be a pp homozygote.
½ × ½ = ¼ or 0.25
Only 25 %, or one outcome out of four, will result in a plant homozygous for white flower color (pp). The possibility that any one plant will be a PP homozygote is also 1/4. The heterozygous allele combination can happen twice (Pp or pP), so the two probabilities are added together ¼ + ¼ = 2/4, or ½. The probability that an offspring plant will be Pp heterozygous is ½.
Testcross and Punnett Squares
Suppose you have a purple and white flower and, purple color is dominant to white. The white flower must be homozygous for the recessive allele, but the genotype of the purple flower is unknown. It could be either PP or Pp. A testcross will determine the organism’s genotype. In a testcross, the individual with the unknown genotype is crossed with a homozygous recessive individual (Figure 2). The unknown genotype can be determined by observing the phenotypes of the resulting offspring.

Figure 2: A testcross helps reveal the genotype of an organism when that organism shows the dominant trait, such as agouti coat color in rats. Such an organism could be homozygous dominant or heterozygous. Agouti is the common color of the Norway rat, Rattus norvegicus.
Dihybrid Crosses and Punnett Squares
Dihybrid crosses are more complicated than monohybrid crosses because more combinations of alleles are possible. For example, tracking the inheritance of seed color and pod color in a Punnett square requires that we track four alleles. G is the dominant allele for green pod color and g is the recessive allele for yellow pods. Y is the dominant allele for yellow seed color and y is the recessive allele for green seed color.
Two plants are crossed, one is true-breeding for green pods and yellow seeds (GGYY), the other is true-breeding for yellow pods and green seeds (ggyy). All of the \(F_1\) generation will be heterozygous for both traits (GgYy). Figure 3, shows the dihybrid cross of the dihybrid P generation and the \(F_1\) generation.

Figure 3: The dihybrid crosses were started by crossing two true-breeding plants, just as the monohybrid crosses were. The ratio of phenotypes (9:3:3:1) can be determined from the dihybrid Punnett square on the right. The genotype of the \(F_2\) generation can also be determined.
Heterozygous Dihybrid Cross
In a dihybrid cross, four alleles can be inherited from any one parent at one time. When two heterozygous individuals are crossed, there are a total of 16 possible combinations of the four alleles. The phenotypes of the offspring with two independent traits show a 9:3:3:1 ratio. In a cross involving pea plants heterozygous for round, yellow seeds (GgYy), 9/16 plants have round, yellow seeds, 3/16 have round, green seeds, 3/16 have wrinkled, yellow seeds, and 1/16 has wrinkled, green seeds.
Mendelian Inheritance in Humans
A pedigree is a chart which shows the inheritance of a trait over several generations. A pedigree is commonly created for families, and it outlines the inheritance patterns of genetic disorders. Figure 4 shows a pedigree depicting recessive inheritance of a disorder through three generations. Scientists can tell the genetics of inheritance from studying a pedigree, such as whether the trait is sex-linked (on the X or Y chromosome) or autosomal (on a chromosome that does not determine sex), whether the trait is inherited in a dominant or recessive fashion, and possibly whether individuals with the trait are heterozygous or homozygous.
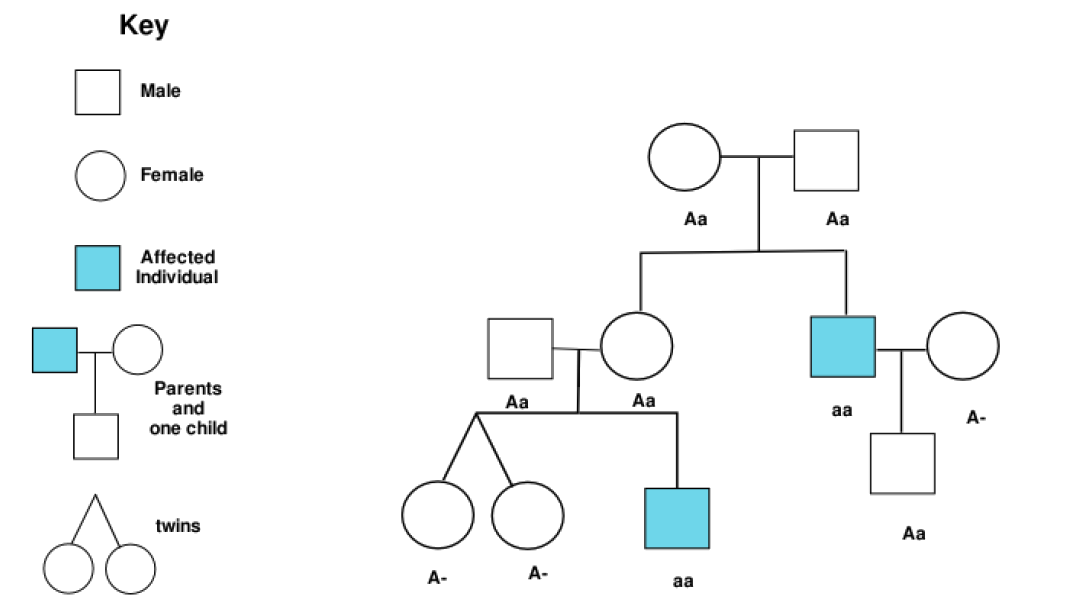
Figure 4: In a pedigree, squares symbolize males, and circles represent females. A horizontal line joining a male and female indicates that the couple had offspring. Vertical lines indicate offspring which are listed left to right, in order of birth. Shading of the circle or square indicates an individual who has the trait being traced. The inheritance of the recessive trait is being traced. A is the dominant allele and a is recessive.
Is the trait sex-linked or autosomal?
A sex chromosome is a chromosome that determines the sex of an organism. Humans have two sex chromosomes, X and Y. Females have two X chromosomes (XX), and males have one X and one Y (XY). An autosome is any chromosome other than a sex chromosome. If a trait is autosomal it will affect males and females equally.
A sex-linked trait is a trait whose allele is found on a sex chromosome. The human X chromosome is significantly larger than the Y chromosome; there are many more genes located on the X chromosome than there are on the Y chromosome. As a result there are many more X-linked traits than there are Y-linked traits. Most sex-linked traits are recessive. Because males carry only one X chromosome, if they inherit a recessive sex-linked gene they will show a sex-linked condition.
Because of the recessive nature of most sex-linked traits, a female who shows a sex-linked condition would have to have two copies of the sex-linked allele, one on each of her X chromosomes. Figure 5 shows how red-green colorblindness, a sex-linked disorder, is passed from parent to offspring.

Figure 5: An X-linked disorder such as red-green colorblindness is normally passed onto the son of a carrier mother. Usually, females are unaffected as they have a second, normal copy of the allele on the second X chromosome. However, if a female inherits two defective copies of the allele, she will be colorblind. Therefore, every son of a colorblind woman will be colorblind.
Is the Trait Dominant or Recessive?
If the trait is autosomal dominant, every person with the trait will have a parent with the trait. If the trait is recessive, a person with the trait may have one, both or neither parent with the trait. An example of an autosomal dominant disorder in humans is Huntington’s disease (HD). Huntington’s disease is a degenerative disease of the nervous system. It has no obvious effect on phenotype until the person is aged 35 to 45 years old. The disease is non-curable and, eventually, fatal. Every child born to a person who develops HD has a 50% chance of inheriting the defective allele from the parent.
Are the Individuals with the Trait Heterozygous or Homozygous?
If a person is homozygous or heterozygous for the dominant allele of a trait, they will have that trait. If the person is heterozygous for a recessive allele of the trait, they will not show the trait. A person who is heterozygous for a recessive allele of a trait is called a carrier. Only people who are homozygous for a recessive allele of a trait will have the trait.
Non-Mendelian Modes of Inheritance
The relationship between genotype and phenotype is rarely as simple as the examples Mendel studied. Each characteristic he studied had two alleles, one of which was completely dominant and the other completely recessive. Geneticists now know that alleles can be codominant, or incompletely dominant.
Codominance
Codominance occurs when both traits appear in a heterozygous offspring. Neither allele is completely dominant nor completely recessive. For example, roan shorthorn cattle have codominant genes for hair color. The coat has both red and white hairs. The letter R indicates red hair color, and R’ white hair color. In cases of codominance, the genotype of the organism can be determined from its phenotype. The heifer in Figure 6 is RR’ heterozygous for coat color.

Figure 6: The roan coat of this shorthorn heifer is made up of red and white hairs. Both the red and white hair alleles are codominant. Therefore cattle with a roan coat are heterozygous for coat color (RR’).
Incomplete Dominance
Incomplete dominance occurs when the phenotype of the offspring is somewhere in between the phenotypes of both parents; a completely dominant allele does not occur. For example, when red snapdragons (\(C^R C^R\)) are crossed with white snapdragons (\(C^W C^W\)), the \(F_1\) hybrids are all pink hetrozygotes for flower color (CRCW). The pink color is an intermediate between the two parent colors. When two \(F_1\) (\(C^R C^W\)) hybrids are crossed they will produce red, pink, and white flowers. The genotype of an organism with incomplete dominance can be determined from its phenotype (Figure 7).

Figure 7: Snapdragons show incomplete dominance in the traits for flower color. The offspring of homozygous red-flowered and homozygous white-flowered parents are heterozygous pink-flowered.
Complex Forms of Heredity
Traits that are affected by more than one gene are called polygenic traits. The genes that affect a polygenic trait may be closely linked on a chromosome, unlinked on a chromosome, or on different chromosomes. Polygenic traits are often difficult for geneticists to track because the polygenic trait may have many alleles. Also, independent assortment ensures the genes combine differently in gametes. Therefore, many different intermediate phenotypes exist in offspring. Eye color (Figure 8), and skin color are examples of polygenic traits in humans.

Figure 8: Eye color and skin color are examples of polygenic traits; they are influenced by more than one gene.
When three or more alleles determine a trait, the trait is said to have multiple alleles. The human ABO blood group is controlled by a single gene with three alleles: i, \(I^A\), \(I^B\), and the recessive i allele. The gene encodes an enzyme that affects carbohydrates that are found on the surface of the red blood cell. A and B refer to two carbohydrates found on the surface of red blood cells. There is not an O carbohydrate. Type O red blood cells do not have either type A or B carbohydrates on their surface.
The alleles \(I^A\) and \(I^B\) are dominant over i. A person who is homozygous recessive ii has type O blood. Homozygous dominant \(I^A\)\(I^A\) or heterozygous dominant IAi have type A blood, and homozygous dominant \(I^B\)\(I^B\) or heterozygous dominant \(I^B i\) have type B blood. \(I^A I^B\) people have type AB blood, because the A and B alleles are codominant. Type A and type B parents can have a type AB child. Type A and a type B parent can also have a child with Type O blood, if they are both heterozygous (\(I^B i, I^A i\)). The table (2) shows how the different combinations of the blood group alleles can produce the four blood groups, A, AB, B, and O.
Table 2: Bloodtype as Determined by Multiple Alleles
| \(\;\;\;\;\;\) | \(I^A\)\(\;\;\;\;\;\) | \(I^B\)\(\;\;\;\;\;\) | \(i\)\(\;\;\;\;\;\) |
|---|---|---|---|
| \(I^A\)\(\;\;\;\;\;\) | \(I^A I^A\)\(\;\;\;\;\;\) | \(I^A I^B\)\(\;\;\;\;\;\) | \(I^A i\)\(\;\;\;\;\;\) |
| TYPE A | TYPE AB | TYPE A | |
| \(I^B\) | \(I^A I^B\) | \(I^B I^B\) | \(I^B i\) |
| TYPE AB | TYPE B | TYPE B | |
| \(i\) | \(i I^A\) | \(i I^B\) | \(i i\) |
| TYPE A | TYPE B | TYPE O |
Effects of Environment on Phenotype
Genes play an important part in influencing phenotype, but genes are not the only influence. Environmental conditions, such as temperature and availability of nutrients can affect phenotypes. For example, temperature affects coat color in Siamese cats.
The pointed pattern is a form of partial albinism, which results from a mutation in an enzyme that is involved in melanin production. The mutated enzyme is heat-sensitive; it fails to work at normal body temperatures. However, it is active in cooler areas of the skin. This results in dark coloration in the coolest parts of the cat’s body, such as the lower limbs and the face, as shown in Figure 9. The cat’s face is cooled by the passage of air through the nose. Generally adult Siamese cats living in warm climates have lighter coats than those in cooler climates.

Figure 9: The dark “points,” on this Siamese cat are caused by a gene that codes for a temperature-sensitive enzyme. The enzyme, which causes a darkening of the cat’s fur, is active only in the cooler parts of the body such as the tail, feet, ears, and area around the nose.
Height in humans is influenced by many genes, but is also influenced by nutrition. A person who eats a diet poor in nutrients will not grow as tall as they would have had they eaten a more nutritious diet. Scientists often study the effects of environment on phenotype by studying identical twins. Identical twins have the same genes, so phenotypic differences between twins often have an environmental cause.
Images courtesy of:
CK-12 Foundation. http://commons.wikimedia.org/wiki/Image:Blauwschokker_Kapucijner_rijserwt_bloem_Pisum_sativum.jpg. GNU-FDL.
CK-12 Foundation.
http://www.flickr.com/photos/forbiddendoughnut/462468304/in/datetaken/
http://www.flickr.com/photos/alexk100/444028894/in/datetaken/. CC-BY-SA 2.0.
Rozzychan. http://en.wikipedia.org/wiki/Image:PedigreechartB.png. CC-BY-SA 2.5.
Niamh Gray Wilson. CC-BY-SA.
Robert Scarth. http://www.flickr.com/photos/robert_scarth/63966084/. CC-BY-SA 2.0.
CK-12 Foundation,Forest & Kim Starr.
http://commons.wikimedia.org/wiki/File:Starr_980630-1518_Antirrhinum_majus.jpg. CC-BY 3.0.
http://www.flickr.com/photos/marypaulose/292958125/
http://www.flickr.com/photos/publicdomainphotos/3478083781/. CC-BY-SA, CC-BY.
TrinnyTrue. http://commons.wikimedia.org/wiki/File:Niobe050905-Siamese_Cat.jpeg. GNU-FDL.